| Issue |
A&A
Volume 702, October 2025
|
|
|---|---|---|
| Article Number | L20 | |
| Number of page(s) | 10 | |
| Section | Letters to the Editor | |
| DOI | https://doi.org/10.1051/0004-6361/202556905 | |
| Published online | 24 October 2025 | |
Letter to the Editor
Investigating aerosols as a way to reconcile K2-18 b JWST MIRI and NIRISS/NIRSpec observations
1
LATMOS/IPSL, UVSQ Université Paris-Saclay, Sorbonne Université, CNRS, Guyancourt, France
2
Laboratoire d’astrophysique de Bordeaux, Univ. Bordeaux, CNRS, B18N, allée Geoffroy Saint-Hilaire, 33615 Pessac, France
3
ETH University, Center for Origin and Prevalence of Life, Department of Earth and Planetary Sciences, 8092 Zurich, Switzerland
⋆ Corresponding author: This email address is being protected from spambots. You need JavaScript enabled to view it.
Received:
19
August
2025
Accepted:
9
October
2025
Abstract
Recent JWST observations of the temperate sub-Neptune K2-18 b with NIRISS SOSS/NIRSpec G395H and MIRI LRS have yielded apparently inconsistent results: the MIRI spectra exhibit spectral features nearly twice as large as those seen at shorter wavelengths, challenging the high-metallicity, CH4-rich nonequilibrium model that fits the NIRISS/NIRSpec data. We performed a suite of atmospheric retrievals on both datasets, including free-chemistry, nonequilibrium, and aerosol models, using laboratory-derived complex refractive indices for a variety of photochemical haze analogs. Free retrievals systematically output lower metallicities than inferred by self-consistent chemical disequilibrium models, and the inclusion of absorbing aerosols, especially CH4-dominated, nitrogen-poor tholins, can further reduce the inferred metallicity by over an order of magnitude. These hazes reproduce the observed NIRISS slope through scattering and match MIRI features via C–H bending absorption near 7 μm, while yielding particle properties consistent with photochemical production in H2-rich atmospheres. Although their inclusion improves the joint fit and reduces tension between datasets, it also significantly lowers the retrieved CH4 abundance, highlighting degeneracies between metallicity, composition, and aerosol properties. Our results underscore the importance of aerosol absorption in interpreting temperate sub-Neptune spectra and motivate future JWST observations and laboratory work to break these degeneracies.
Key words: solid state: volatile / planets and satellites: atmospheres / planets and satellites: composition
© The Authors 2025
 Open Access article, published by EDP Sciences, under the terms of the Creative Commons Attribution License (https://creativecommons.org/licenses/by/4.0), which permits unrestricted use, distribution, and reproduction in any medium, provided the original work is properly cited.
This article is published in open access under the Subscribe to Open model. This email address is being protected from spambots. You need JavaScript enabled to view it. to support open access publication.
1. Introduction
Recent observations with JWST NIRISS SOSS/NIRSpec G395H (Madhusudhan et al. 2023) and MIRI LRS (Madhusudhan et al. 2025) of the temperate sub-Neptune K2-18 b have sparked several debates regarding molecular detections and atmospheric characterization. The detection of CH4 and CO2 using NIRISS SOSS/NIRSpec G395H was initially reported by Madhusudhan et al. (2023), but the presence of CO2 was later challenged and mitigated by Schmidt et al. (2025), before being recently confirmed by Hu et al. (2025). A comprehensive nonequilibrium study confirmed the detection of CH4, while also suggesting a high atmospheric metallicity (∼266) and an elevated C/O ratio (≥2.1) (Jaziri et al. 2025).
Subsequently, the MIRI LRS observations (Madhusudhan et al. 2025) reignited the discussion on molecular detections. However, these data yielded only marginal detection significance (Welbanks et al. 2025; Taylor 2025). A new reduction of the MIRI LRS data, combined with NIRISS SOSS/NIRSpec G395H observations (Luque et al. 2025), reached similar conclusions: a robust detection of CH4, while other molecular signatures remained statistically insignificant.
Nevertheless, one striking aspect of the MIRI LRS observations is the consistently larger amplitude of spectral features compared to those seen in the NIRISS SOSS/NIRSpec G395H data, regardless of the reduction method. These features, which formed the basis of the claimed molecular detections in Madhusudhan et al. (2025), appear inconsistent across the full set of observations. This can be seen in the joint analysis by Luque et al. (2025).
Given the apparent slope at shorter wavelengths in the NIRISS SOSS data and the high inferred abundance of methane (Madhusudhan et al. 2023, 2025; Hu et al. 2025), aerosols, such as methane clouds or photochemical hazes, are likely present in the atmosphere of K2-18 b. Scattering-induced extinction by these atmospheric particles is known to flatten the spectra at shorter wavelengths without significantly affecting the longer wavelengths. They were, for instance, proposed to explain the flat spectra of the temperate sub-Neptune GJ 1214 b (Gao et al. 2023). The presence of photochemical hazes was also predicted in the simulations of Wogan & Batalha (2024) for K2-18 b. The absorption features observed in the K2-18 b MIRI LRS observations may be attributed to these hazes, reflecting the C-H bending resonances of the solid particles. In this work, we explore the role of aerosols in an effort to reconcile the various JWST observations of K2-18 b. All retrieval data can be downloaded from Zenodo1.
2. Methods
Using the MIRI LRS data reduced with Eureka! (Bell et al. 2022) from Luque et al. (2025), we performed atmospheric retrievals with TauREx 32 (Al-Refaie et al. 2021), including hydrocarbons as motivated by the nonequilibrium models of Jaziri et al. (2025). In combination with the NIRISS SOSS/NIRSpec G395H analysis from Jaziri et al. (2025), this approach aims to emphasize the discrepancies between the two datasets. While the results are data- and model-dependent, we provide here a consistent analysis with one retrieval code of a given set of reduced data, including in particular a complementary analysis of the MIRI LRS data reduced with Eureka!, which was not detailed in Luque et al. (2025).
We began by retrieving a flat spectrum to assess the statistical significance of any spectral features, for both the dataset and the combined dataset. Subsequently, we carried out retrievals including CH4, CO2, CO, H2O, NH3, C2H2, C2H4, H2CO, H2S, SO2, and HCN, which allowed us to identify the key absorbers for the combined analysis. We included these molecules because they have consistent absorption cross-sections computed by ExoMol in hydrogen-rich atmospheres (Chubb et al. 2021). We acknowledge that our reduced sample of hydrocarbons may introduce some quantitative bias in the results. However, Welbanks et al. (2025) showed that many hydrocarbons contribute with similar significance, and that the most abundant species (C2H2, C2H4, and C2H6) likely have comparable abundances (see also Jaziri et al. 2025). For this reason, we prioritized consistency in the opacity data.
We also carried out a retrieval including all molecules using the NIRISS SOSS/NIRSpec G395H data reduced with JExoRES (Madhusudhan et al. 2023) to derive a metallicity that is directly comparable through the same methodology. Additionally, we performed a nonequilibrium chemistry retrieval using TauREx 3 coupled with FRECKLL (Al-Refaie et al. 2024). While this approach remains computationally expensive and is not yet fully stable, it was used to compare our results with nonequilibrium chemistry findings from the NIRISS SOSS/NIRSpec G395H data (Jaziri et al. 2025) and the consistency of the MIRI LRS observations under nonequilibrium conditions. These results are described in Appendix C.
In addition to the gray cloud parametrization used in all retrievals, we then used TauREx 3 together with the TauREx-PyMieScatt3 module (Changeat et al. 2025) to retrieve the combined dataset, including aerosol contributions, and adopting a free-chemistry approach with a subset of relevant molecules selected based on retrievals performed without aerosols. An offset of −41 ppm between the NIRISS SOSS and NIRSpec G395H datasets was adopted from Madhusudhan et al. (2023). For the MIRI LRS dataset, an offset of +160 ppm was applied, determined by fitting it to the best retrieved nonequilibrium model from Jaziri et al. (2025) for the NIRISS SOSS/NIRSpec G395H data (see details in Appendix A).
The contribution of aerosols was accounted for using Mie scattering calculations. Previous strategies relied on the use of a simplified function to include aerosol scattering throughout the Rayleigh and Mie regimes (e.g., Kitzmann & Heng 2017). This approach ignores the absorbing properties of the aerosols, encoded in the imaginary part of the complex refractive index, since absorption is usually negligible compared to scattering for small particles in the visible and near-IR spectral range. In the present work, we include the absorbing properties of photochemical hazes, which could explain the features observed in the K2-18 b observations at longer wavelengths in addition to the scattering effect at shorter wavelengths in the NIRISS SOSS/NIRSpec G395H range. The haze extinction was thus calculated using complex refractive index data obtained on laboratory haze analogs called tholins. The absorption properties of photochemical hazes are known to vary with gas composition, temperature, pressure, and irradiation efficiency (Brassé et al. 2015; Sciamma-O’Brien & Roush 2023; Drant et al. 2024). We thus used seven different datasets compiled from the original study of Khare et al. (1984) and the recent data of Drant et al. (2025) to explore the influence of the haze absorbing properties on the retrieval and final posterior distribution. We performed simulations with the refractive index data of the exoplanet haze analogs that were produced using two different experimental setups (PAMPRE at LATMOS and COSmIC at NASA Ames) using only CH4 as a reactive gas. In addition, we performed simulations with the refractive index data obtained on Titan tholins, using various experimental setups and N2/CH4 ratio. The different refractive index data are summarized in Table 1. In the simulations, haze particles are assumed spherical with a lognormal size distribution, making the particle radius the only microphysical parameter in the retrieval. Photochemical hazes can form fractal aggregates, which increase the effective radius and scattering efficiency. Accounting for aggregates would require additional poorly constrained parameters, such as the number of monomers per particle and the fractal dimension, increasing degeneracy in the retrievals (e.g., Adams et al. 2019). Therefore, only spherical particles were considered.
Summary of the different haze refractive index data considered.
See the priors and retrieval setup in Appendix B. We used the Bayes factor (B), as defined in Benneke & Seager (2013), to assess the statistical significance of one model compared to another. This metric allows us to compare two models using their log-evidences (ln(Z)) and evaluate the relative significance of one retrieval compared to another. A value of ln(B) between 1 and 2.5 indicates weak preference, between 2.5 and 5 indicates moderate preference, and values above 5 indicate strong preference for one model over the other. However, these thresholds should be interpreted with caution, as recent work by Kipping & Benneke (2025) has shown that the strength of evidence may be less decisive than previously assumed.
3. Reconciling NIRISS SOSS/NIRSpec G395H and MIRI LRS observations with aerosols
Previous studies have retrieved high abundances of CH4, ranging from 1% to over 10% (Madhusudhan et al. 2023; Schmidt et al. 2025; Jaziri et al. 2025; Hu et al. 2025). Such significant methane levels suggest the formation of aerosols, such as Titan-like hazes via photochemistry (e.g., Trainer et al. 2006; Arney et al. 2016). Considering the modeled temperatures from previous studies (Charnay et al. 2021; Blain et al. 2021), along with our retrieved low temperatures, the formation of methane clouds is also plausible. These clouds may exhibit similar opacities to photochemical hazes generated in H2-dominated atmospheres. Both hazes and clouds could contribute to the flattening of the spectra at shorter wavelengths, while preserving strong features at longer wavelengths. This could explain the differences in feature amplitudes observed between NIRISS SOSS/NIRSpec G395H and MIRI LRS observations.
In addition, photochemical hazes poor in nitrogen, as expected in H2-dominated sub-Neptune atmospheres, present significant absorption features attributed to C-H stretching (3.4–3.7 μm) and bending (6.7–7.2 μm) resonances (Drant et al. 2025), which partly overlap with the bands of gaseous methane and thus could be also one of the gases consistent with the K2-18 b observations. Similar absorption bands would be expected for methane clouds as well, making them consistent with the observed absorption features.
The combined analysis is driven by the NIRISS SOSS/NIRSpec G395H data, which have already been confirmed to contain significant spectral features, most notably CH4, contrary to the MIRI LRS data. This is further supported by the retrieved metallicity, which remains consistent with the values obtained using only NIRISS SOSS/NIRSpec G395H data (approximately 40 with a free-chemistry model).
We also observe that the combined analysis does not improve the CO2 detection, which is expected since CO2 has no noticeable features in the mid-IR, and shows even less support for C2H4 compared to retrievals based solely on MIRI LRS data. The retrieved abundance of CH4 is also consistent with a previous data reduction analysis from Luque et al. (2025) (see Figure D.4).
For the tholins retrievals, the log-evidence values in Table 2 reveal discrepancies depending on the specific tholins data used. These discrepancies are explained by the variability in the strength and position of the absorption features between the different datasets. One dataset in particular, tholins exo1, is strongly favored. Unlike the others, except for tholins exo2, tholins exo1 lacks features associated with nitrogen bonds and instead shows only –CHx signatures. Although produced from a similar gas composition, tholins exo2 exhibits C=C absorption features, which are not observed in the K2-18 b observations. Only the C-H haze features of tholins exo1 are consistent with the observed spectral features, particularly the 7 μm band previously attributed to DMS and DMDS by Madhusudhan et al. (2025). The contributions of the various tholins datasets to the retrieved spectra are shown in Figure 1, highlighting the spectral specificity of tholins exo1. The different Titan tholins datasets, including the one from Khare et al. (1984) used in Wogan & Batalha (2024), are less favored than exo1. This is explained by the stronger absorbing power of these hazes, produced in N2-rich gas mixtures, and by their different N-H, C≡N, and C=N absorption features, which are not consistent with the K2-18 b observations. This analysis emphasizes the importance of the haze refractive index, particularly the imaginary part of the refractive index that reflects absorption, since it influences the retrieval and can help rule out some haze composition based on the observed features at longer wavelengths.
Free retrieval results for combined observations.
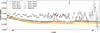 |
Fig. 1. Combined NIRISS SOSS/NIRSpec G395H low-resolution spectra (Madhusudhan et al. 2023) and MIRI LRS Eureka! data reduction spectra (Luque et al. 2025) (error bars). Shown alongside are the retrieved tholins contributions (solid lines) of the different tholins data for each corresponding combined retrieval. |
The best-fit model includes tholins exo1 and is preferred over models without tholins, though the preference is at the threshold between strong and moderate significance. The spectrum and its contributions are shown in Figure D.1, illustrating two key points:
Increased scale height: Compared to retrievals without tholins, the atmosphere’s base appears at a lower transit depth, decreasing from ∼0.0028 to ∼0.0025. This corresponds to a significantly lower-retrieved metallicity, dropping from 19.63 to 0.29, relative to the reference retrieval (see Table 2). This reflects the well-known degeneracy between cloud-top pressure and the atmospheric metallicity. It also leads to a substantially lower-retrieved CH4 abundance, reduced by about two orders of magnitude (see Figures D.4 and D.3).
Tholins spectral contribution: Tholins exo1 contributes to the observed features across multiple spectral ranges: near 7 μm in the MIRI LRS range and around 3.4 μm in the NIRSpec G395H range (alongside CH4), where absorption dominates; and at shorter wavelengths in the NIRISS SOSS range, affecting the spectral slope as scattering dominates. Notably, the retrieved CH4 abundance decreases from 6.3 × 10⁻² to 3.0 × 10⁻⁴ when considering these photochemical hazes compared to the reference model. The haze properties retrieved are also reasonable and in agreement with the modeling predictions of Lavvas et al. (2019) made for the temperature sub-Neptune GJ 1214 b. For the retrieval considering exo1 tholins, we constrain the particle radius in log unit to -1.65 (in μm), the haze density in log unit to 11.22
 (m−3), the mean pressure of the haze layer in log unit to −0.04
 (in Pa), and the dP of the haze layer in log unit to 2.05
 (in Pa); see Figure D.3. The retrievals considering hazes also tend to increase the atmospheric temperature (see Figure D.2), which along with the haze properties and the methane abundance affects the strength of the spectral features. Although this result reflects a degenerate behavior between different parameters influencing extinction, its physical meaning is reasonable, as haze absorption in the UV-visible tends to increase the temperature of the upper atmosphere (Arney et al. 2016). This increased temperature, driven by the haze’s heating properties, could inhibit the formation of methane clouds and prevent their coexistence with solid organic hazes.
While the spectral fit is broadly consistent when considering photochemical hazes, the resulting decrease in the retrieved CH4 abundance goes against the initial motivation for considering their presence. The presence of photochemical hazes produced from gaseous methane is, however, generally consistent with the current data.
4. Conclusions
We investigated the apparent inconsistency between the JWST NIRISS SOSS/NIRSpec G395H and MIRI LRS transmission spectra of the temperate sub-Neptune K2-18 b. The MIRI LRS observations exhibit apparent spectral features with amplitudes roughly twice those seen in the NIRISS SOSS/NIRSpec G395H data, which cannot be reproduced by the high-metallicity nonequilibrium model fitting the shorter-wavelength observations. Free-chemistry and nonequilibrium retrievals on the MIRI LRS spectrum instead favor lower metallicities and molecular compositions that are inconsistent with the NIRISS/NIRSpec results. However, none of the tested molecular models are statistically preferred over a flat spectrum for MIRI LRS alone.
To reconcile the datasets, we explored the role of aerosols, specifically photochemical hazes and methane clouds, which can flatten spectra at shorter wavelengths, while preserving or enhancing features at longer wavelengths. Using laboratory-derived complex refractive indices for a range of haze analogs, we find that only hazes produced in CH4-dominated mixtures without nitrogen and C=C features (tholins exo1) yield absorption signatures consistent with the combined NIRISS, NIRSpec, and MIRI data. These hazes naturally reproduce the observed slope in the NIRISS SOSS range through scattering, while contributing C–H bending absorption features near 7 μm in the MIRI LRS range.
The inclusion of such hazes improves the combined fit and moderately reduces the tension between the two datasets, albeit at the cost of significantly lowering the retrieved CH4 abundance. The retrieved haze particle sizes, number densities, and layer pressures are broadly consistent with the theoretical predictions for H2-dominated sub-Neptune atmospheres, and the associated temperature increases in the upper atmosphere are physically plausible given aerosol absorption in the optical.
Overall, our results highlight the importance of aerosol absorption, particularly the imaginary component of the refractive index, in interpreting the atmospheres of temperate sub-Neptunes. While photochemical hazes offer a promising explanation for the discrepancy between short- and long-wavelength observations of K2-18 b, the current data do not yet allow a definitive determination of their composition or abundance. Future JWST observations and higher precision, alongside expanded laboratory measurements of exoplanet haze analogs, will be essential to break degeneracies between metallicity, molecular composition, and aerosol properties.
Acknowledgments
This project has received funding from the European Research Council (ERC) under the ERC OxyPlanets projects (grant agreement No. 101053033). This project acknowledges funding from the European Research Council (ERC) under the European Union’s Horizon 2020 research and innovation programme (grant agreement No. 679030/WHIPLASH). T.D. acknowledges support by the 2024 NOMIS-ETH postdoc fellowship program. T.D. thanks the NOMIS foundation and ETH Zurich for funding via the 2024 Fellowship program. Some of the data presented in this paper were obtained from the Mikulski Archive for Space Telescopes (MAST) at the Space Telescope Science Institute. The specific observations analyzed can be accessed via doi:10.17909/3ds1-8z15 and doi:10.17909/rx29-yw62. We would like to thank the anonymous referee for his pertinent comments, which improved the presentation of our results.
References
- Adams, D., Gao, P., de Pater, I., & Morley, C. 2019, ApJ, 874, 61 [NASA ADS] [CrossRef] [Google Scholar]
- Al-Refaie, A. F., Changeat, Q., Waldmann, I. P., & Tinetti, G. 2021, ApJ, 917, 37 [NASA ADS] [CrossRef] [Google Scholar]
- Al-Refaie, A. F., Venot, O., Changeat, Q., & Edwards, B. 2024, ApJ, 967, 132 [NASA ADS] [CrossRef] [Google Scholar]
- Arney, G. N., Domagal-Goldman, S. D., Meadows, V. S., et al. 2016, Astrobiology, 16, 873 [Google Scholar]
- Bell, T., Ahrer, E.-M., Brande, J., et al. 2022, J. Open Source Software, 7, 4503 [NASA ADS] [CrossRef] [Google Scholar]
- Benneke, B., & Seager, S. 2013, ApJ, 778, 153 [Google Scholar]
- Blain, D., Charnay, B., & Bézard, B. 2021, A&A, 646, A15 [EDP Sciences] [Google Scholar]
- Brassé, C., Muñoz, O., Coll, P., & Raulin, F. 2015, Planet. Space Sci., 109–110, 159 [Google Scholar]
- Changeat, Q., Bardet, D., Chubb, K., et al. 2025, A&A, 699, A219 [NASA ADS] [CrossRef] [EDP Sciences] [Google Scholar]
- Charnay, B., Blain, D., Bézard, B., et al. 2021, A&A, 646, A171 [NASA ADS] [CrossRef] [EDP Sciences] [Google Scholar]
- Chubb, K. L., Rocchetto, M., Yurchenko, S. N., et al. 2021, A&A, 646, A21 [NASA ADS] [CrossRef] [EDP Sciences] [Google Scholar]
- Drant, T., Garcia-Caurel, E., Perrin, Z., et al. 2024, A&A, 682, A6 [NASA ADS] [CrossRef] [EDP Sciences] [Google Scholar]
- Drant, T., Sciamma-O’Brien, E., Jovanovic, L., et al. 2025, A&A, submitted [Google Scholar]
- Gao, P., Wakeford, H., Moran, S., & Parmentier, V. 2021, JGR Planets, 126 [Google Scholar]
- Gao, P., Piette, A. A. A., Steinrueck, M. E., et al. 2023, ApJ, 951, 96 [NASA ADS] [CrossRef] [Google Scholar]
- Hu, R., Bello-Arufe, A., Tokadjian, A., et al. 2025, arXiv e-prints [arXiv:2507.12622] [Google Scholar]
- Jaziri, A. Y., Sohier, O., Venot, O., & Carrasco, N. 2025, A&A, 701, 12 [Google Scholar]
- Khare, B. N., Sagan, C., Arakawa, E. T., et al. 1984, Icarus, 60, 127 [CrossRef] [Google Scholar]
- Kipping, D., & Benneke, B. 2025, arXiv e-prints [arXiv:2506.05392] [Google Scholar]
- Kitzmann, D., & Heng, K. 2017, MNRAS, 475, 94 [Google Scholar]
- Lavvas, P., Koskinen, T., Steinrueck, M. E., et al. 2019, ApJ, 878, 118 [NASA ADS] [CrossRef] [Google Scholar]
- Luque, R., Piaulet-Ghorayeb, C., Radica, M., et al. 2025, A&A, 700, A284 [NASA ADS] [CrossRef] [EDP Sciences] [Google Scholar]
- Madhusudhan, N., Sarkar, S., Constantinou, S., et al. 2023, ApJ, 956, L13 [NASA ADS] [CrossRef] [Google Scholar]
- Madhusudhan, N., Constantinou, S., Holmberg, M., et al. 2025, ApJ, 983, L40 [Google Scholar]
- Schmidt, S. P., MacDonald, R. J., Tsai, S. M., et al. 2025, arXiv e-prints [arXiv:2501.18477] [Google Scholar]
- Sciamma-O’Brien, E., Roush, T. L., et al. 2023, Planet. Sci. J., 4, 121 [Google Scholar]
- Taylor, J. 2025, Res. Notes Am. Astron. Soc., 9, 118 [Google Scholar]
- Trainer, M., Pavlov, A., DeWitt, H. L., et al. 2006, PNAS, 103, 18035 [Google Scholar]
- Welbanks, L., Nixon, M. C., McGill, P., et al. 2025, arXiv e-prints [arXiv:2504.21788] [Google Scholar]
- Wogan, N. F., Batalha, N. E., et al. 2024, ApJ, 963, L7 [NASA ADS] [CrossRef] [Google Scholar]
Appendix A: Dataset offset
Using different telescope instruments can introduce biases between datasets, such as flux offsets. In this study, we work with three JWST datasets obtained from three different instruments: NIRISS SOSS, NIRSpec G395H, and MIRI LRS. For the NIRISS SOSS and NIRSpec G395H data, we use the observations from Madhusudhan et al. (2023), along with their reported offset of –41 ppm. The MIRI LRS data are taken from the Eureka! reduction from Luque et al. (2025), who found a flux offset ranging from approximately +120 ppm to +160 ppm depending on their retrieval priors or retrieval code.
To ensure consistency with the nonequilibrium modeling results from Jaziri et al. (2025), we use their best-fitting model to determine the optimal offset for the MIRI LRS dataset via a χ2 minimization approach. The resulting χ2 values as a function of the wavelength shift are shown in Figure A.1, along with a second-order polynomial fit. The minimum χ2 corresponds to an offset of +160 ppm, which we adopt for this study.
All these offsets are fixed to reduce the parameter space and accelerate aerosol retrievals. A more detailed investigation of their effects could be carried out in future work.
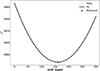 |
Fig. A.1. χ2 of the best nonequilibrium model from Jaziri et al. (2025), shown as a function of the MIRI LRS wavelength shift and based on the combined JWST observations from NIRISS SOSS, NIRSpec G395H (Madhusudhan et al. 2023), and MIRI LRS (Luque et al. 2025). Blue crosses indicate the computed values, and a second-order polynomial fit is indicated by a solid black line, with its minimum value (160 ppm) marked by a black dot. |
Appendix B: Retrieval setup
We performed four types of retrievals: flat-line, nonequilibrium chemistry, and constant-chemistry (with and without aerosols).
The flat-line retrieval was conducted by retrieving the planetary radius and a cloud deck, following the priors listed in Table B.1. A minimal amount of H2O (between 10−12 and 10−11) was included, as TauREx 3 requires at least one absorber to run. The radius and the cloud deck are also retrieved for all other retrievals following the same priors.
For all other retrievals, the temperature profile was parameterized with 4-points. This is the minimum required to allow for a thermal inversion, capture deep-atmosphere temperatures relevant to disequilibrium chemistry and quenching processes, and assess aerosol impacts on the upper-atmosphere temperature. Temperature priors are detailed in Table B.1.
The nonequilibrium chemistry retrieval was carried out using FRECKLL coupled with TauREx 3, without aerosols. Kzz has been set to 1010. Its value, within common range of values, has been shown in Jaziri et al. (2025) to not significantly affect the retrieval. The priors are detailed in Table B.1. Due to its high computational cost and limited stability, we present only one nonequilibrium retrieval, applied to the MIRI LRS data, which contain relatively few data points. This allows us to assess the consistency of the MIRI LRS observations under nonequilibrium conditions. We used 800 live points for all retrievals.
We then used vertically constant profiles for the chemical species (commonly referred to as free chemistry), including all the molecules listed in Table B.1, with their corresponding priors, for retrievals on the MIRI LRS data. This set of molecules represents the main species of interest that have been highlighted in the literature and are available in the ExoMol database, which is the most relevant source for opacities calculated for H2-dominated atmospheres. Each molecule was removed individually to assess its significance compared to the reference case with all molecules. A subset of the most significant molecules was then selected to reduce computational cost in subsequent retrievals that include aerosols, which are more expensive to model. The aerosol priors are also provided in Table B.1. This optimized subset of molecules was then used for retrievals of combined NIRISS SOSS, NIRSpec G395H, and MIRI LRS data, both with and without aerosols, using the same set of priors.
Free parameters and priors for the retrievals.
Appendix C: Inconsistency between NIRISS SOSS/NIRSpec G395H and MIRI LRS observations
The NIRISS SOSS/NIRSpec G395H data exhibit feature amplitudes of approximately 200 ppm, whereas the MIRI LRS data show features at least twice as large. The relatively small amplitudes in the NIRISS SOSS/NIRSpec G395H data have been shown to favor high metallicity, with a value of 266 inferred using a nonequilibrium chemical model (Jaziri et al. 2025). However, the best-fit nonequilibrium model, using a grid of forward models with FRECKLL, from Jaziri et al. (2025) appears inconsistent with the larger spectral amplitudes seen in the MIRI LRS data, as illustrated in Figure C.1.
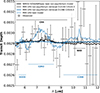 |
Fig. C.1. Spectrum from the MIRI LRS Eureka! data reduction (Luque et al. 2025) (error bars) compared to the best nonequilibrium model from Jaziri et al. (2025) (solid black line) fitting the NIRISS SOSS/NIRSpec G395H observations. The spectrum is also compared to the two MIRI LRS nonequilibrium retrieval solutions (solid light black line: low metallicity; solid blue line: high metallicity) and to the best MIRI LRS model (solid light blue line), all shown at a resolution of 200. Key spectral features are highlighted in the corresponding colors. |
When applying a free-chemistry retrieval to the MIRI LRS data, we are able to fit the larger spectral features. The log-evidence results in Table C.1 indicate that the three most favored molecules are C2H2, H2CO, and C2H4. These molecules have absorption bands that align with the apparent features in the MIRI LRS spectrum, as shown in Figure C.1, where the best-fit model is overplotted on the observations. The retrieved metallicity is significantly lower, with a maximum value of 4.42 , compared to the value of 266 reported by Jaziri et al. (2025). It is important to note that Jaziri et al. (2025) used a nonequilibrium chemical model.
A retrieval using all molecules on the NIRISS SOSS/NIRSpec G395H data yields a metallicity of 40.56 , demonstrating that, in our case, free-chemistry retrievals tend to bias metallicities toward lower values compared to nonequilibrium models. Following Welbanks et al. (2025), this bias arises, at least in part, because we excluded from the retrieval certain species that may be abundant and influence the mean molecular weight but do not exhibit prominent spectral features, such as N2, in order to improve computational efficiency. This effect is also seen in our results when comparing retrievals with the full set of molecules to those with the reduced set (see metallicities in Tables C.1 and 2). Nevertheless, the MIRI LRS retrievals, performed with the same setup as the NIRISS SOSS/NIRSpec G395H analysis and therefore directly comparable, tend to favor lower metallicity (from 40.56
 to 4.42
 ) to increase the scale height, allowing better fits to the larger observed features.
These results are inconsistent with those from the NIRISS SOSS/NIRSpec G395H analysis and the nonequilibrium chemical model, both of which favor higher metallicity and a high CH4 abundance, as seen in Figure C.1. In contrast, the MIRI LRS retrievals indicate low metallicity and do not show a preference for CH4. However, as shown in Table C.1, none of the tested models are statistically favored over a flat line. At best, they fall within the "weak preference" range. H2CO is unlikely to be dominant. Its retrieved abundance of 10−5 exceeds the 3σ upper limit derived by Jaziri et al. (2025). C2H2 and C2H4 could plausibly be present, especially considering high C/O ratio and high metallicity. However, the retrievals favor C2H2 over CH4, which is inconsistent with the NIRISS SOSS/NIRSpec G395H data. Our conclusions are consistent with previous analyses of MIRI LRS data using alternative reduction pipelines (Madhusudhan et al. 2025; Taylor 2025; Welbanks et al. 2025), which likewise report no significant spectral signatures. A possible exception is a weak indication of H2CO, though this is not statistically robust in a Bayesian framework and may simply reflect reduction-dependent systematics. In particular, features around 5-6 μm, where H2CO absorption could occur, appear sensitive to the choice of data reduction, limiting the reliability of this tentative signal.
For the combined analysis, we therefore adopted CH4, C2H4, and CO2 as the key molecules. CO2 remains somewhat uncertain in the NIRISS SOSS/NIRSpec G395H data, but was included for completeness since it has been recently confirmed with the new data from Hu et al. (2025).
Finally, a nonequilibrium chemistry retrieval on the MIRI LRS data reveals that the feature amplitudes are inconsistent with such models. The solution shows bimodality (see Figure C.2), with one mode corresponding to a low radius (0.2173 RJup) and low metallicity (0.04
 ) to produce a high scale height, and the other corresponding to a higher radius (0.2245
 RJup) and high metallicity (266
 ). In the high-metallicity case, a higher C/O ratio (> 3.5) is also preferred, which enhances C2H2 and C2H4 features, similar to the free retrieval, but makes the result inconsistent with the NIRISS SOSS and NIRSpec G395H data that favor CH4 and NH3 features (see Figure C.1). Higher temperatures (> 340 K) are also favored. The feature amplitudes appear smaller compared to the data, although this mismatch is somewhat reduced in the low-metallicity scenario where CH4 is dominant. Nonetheless, the feature amplitudes remain smaller than those predicted by the free-chemistry retrieval and the observed amplitudes (see Figure C.1).
Since none of the models are statistically significant, we cannot draw definitive conclusions, but these inconsistencies suggest that a key process may be missing from our current models.
Retrieval results for MIRI LRS
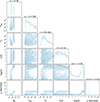 |
Fig. C.2. Corner plot of the nonequilibrium retrieval model using FRECKLL on the MIRI LRS Eureka! data reduction (Luque et al. 2025). |
Appendix D: Joint NIRISS SOSS/NIRSpec G395H and MIRI LRS data additional materials
In this appendix, we present Figure D.1 and Figure D.3 respectively the spectral contributions and the corner plot of the best-fit model from the joint NIRISS SOSS/NIRSpec G395H and MIRI LRS retrieval, as well as the temperature profiles from two retrievals Figure D.2, with and without haze, to illustrate the effect of haze on the retrieved temperature, as discussed in Section 3. Figure D.4 show the corner plot of free retrieval model with CH4/C2H4/CO2 on the combine spectra. Figure D.4 show the corner plot of free retrieval model with CH4/C2H4/CO2 on the combine spectra. Our retrieved temperatures in Figure D.2 are generally higher than the condensation curve for methane (see Fig 1 of Gao et al. (2021) for example) which may suggest that photochemical hazes are a more likely aerosol candidate than methane clouds to reconcile the K2-18 b JWST observations.
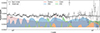 |
Fig. D.1. Combined spectra of NIRISS SOSS/NIRSpec G395H low-resolution data (Madhusudhan et al. 2023) and MIRI LRS Eureka! data reduction (Luque et al. 2025) (error bars). Shown alongside are the best-fitting model (solid black line) and its contributions. This corresponds to the retrieval including tholins exo1. |
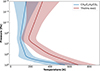 |
Fig. D.2. Retrieved temperature profile and uncertainty from the retrieval using CH4/C2H4/CO2 (blue) with the addition of tholins exo1 (brown), based on combined observations. |
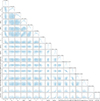 |
Fig. D.3. Corner plot of the best retrieval model on combined spectra of NIRISS SOSS/NIRSpec G395H (Madhusudhan et al. 2023) and MIRI LRS Eureka! data reduction (Luque et al. 2025). This corresponds to the retrieval including tholins exo1. |
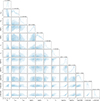 |
Fig. D.4. Corner plot of the free-retrieval model with CH4/C2H4/CO2 on the combine spectra of NIRISS SOSS/NIRSpec G395H (Madhusudhan et al. 2023) and MIRI LRS Eureka! data reduction (Luque et al. 2025). |
All Tables
All Figures
|
Fig. 1. Combined NIRISS SOSS/NIRSpec G395H low-resolution spectra (Madhusudhan et al. 2023) and MIRI LRS Eureka! data reduction spectra (Luque et al. 2025) (error bars). Shown alongside are the retrieved tholins contributions (solid lines) of the different tholins data for each corresponding combined retrieval. |
| In the text | |
|
Fig. A.1. χ2 of the best nonequilibrium model from Jaziri et al. (2025), shown as a function of the MIRI LRS wavelength shift and based on the combined JWST observations from NIRISS SOSS, NIRSpec G395H (Madhusudhan et al. 2023), and MIRI LRS (Luque et al. 2025). Blue crosses indicate the computed values, and a second-order polynomial fit is indicated by a solid black line, with its minimum value (160 ppm) marked by a black dot. |
| In the text | |
|
Fig. C.1. Spectrum from the MIRI LRS Eureka! data reduction (Luque et al. 2025) (error bars) compared to the best nonequilibrium model from Jaziri et al. (2025) (solid black line) fitting the NIRISS SOSS/NIRSpec G395H observations. The spectrum is also compared to the two MIRI LRS nonequilibrium retrieval solutions (solid light black line: low metallicity; solid blue line: high metallicity) and to the best MIRI LRS model (solid light blue line), all shown at a resolution of 200. Key spectral features are highlighted in the corresponding colors. |
| In the text | |
|
Fig. C.2. Corner plot of the nonequilibrium retrieval model using FRECKLL on the MIRI LRS Eureka! data reduction (Luque et al. 2025). |
| In the text | |
|
Fig. D.1. Combined spectra of NIRISS SOSS/NIRSpec G395H low-resolution data (Madhusudhan et al. 2023) and MIRI LRS Eureka! data reduction (Luque et al. 2025) (error bars). Shown alongside are the best-fitting model (solid black line) and its contributions. This corresponds to the retrieval including tholins exo1. |
| In the text | |
|
Fig. D.2. Retrieved temperature profile and uncertainty from the retrieval using CH4/C2H4/CO2 (blue) with the addition of tholins exo1 (brown), based on combined observations. |
| In the text | |
|
Fig. D.3. Corner plot of the best retrieval model on combined spectra of NIRISS SOSS/NIRSpec G395H (Madhusudhan et al. 2023) and MIRI LRS Eureka! data reduction (Luque et al. 2025). This corresponds to the retrieval including tholins exo1. |
| In the text | |
|
Fig. D.4. Corner plot of the free-retrieval model with CH4/C2H4/CO2 on the combine spectra of NIRISS SOSS/NIRSpec G395H (Madhusudhan et al. 2023) and MIRI LRS Eureka! data reduction (Luque et al. 2025). |
| In the text | |
Current usage metrics show cumulative count of Article Views (full-text article views including HTML views, PDF and ePub downloads, according to the available data) and Abstracts Views on Vision4Press platform.
Data correspond to usage on the plateform after 2015. The current usage metrics is available 48-96 hours after online publication and is updated daily on week days.
Initial download of the metrics may take a while.