Fig. C.1.
Download original image
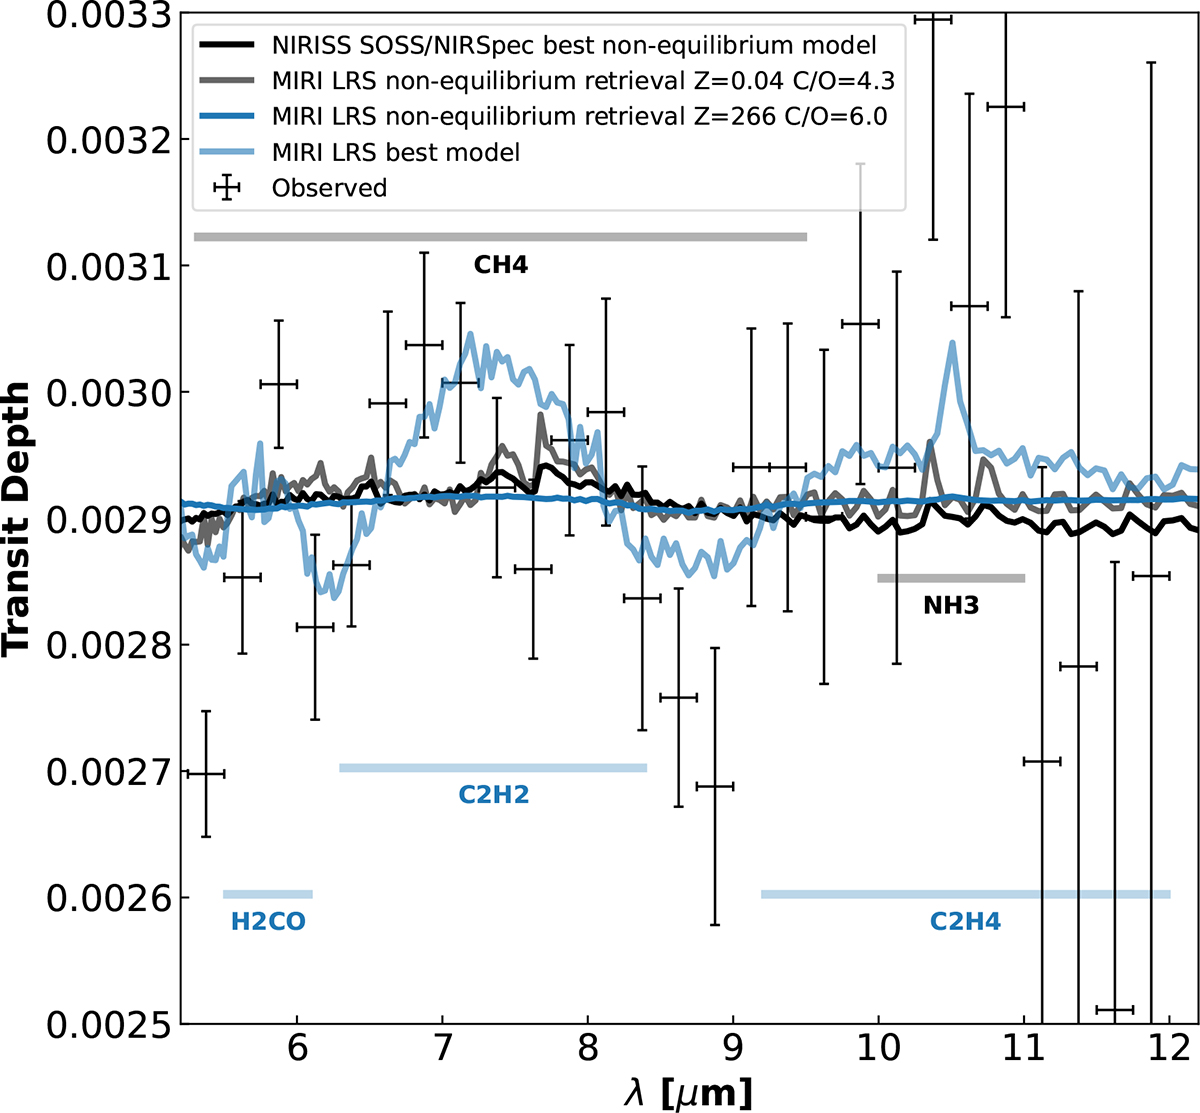
Spectrum from the MIRI LRS Eureka! data reduction (Luque et al. 2025) (error bars) compared to the best nonequilibrium model from Jaziri et al. (2025) (solid black line) fitting the NIRISS SOSS/NIRSpec G395H observations. The spectrum is also compared to the two MIRI LRS nonequilibrium retrieval solutions (solid light black line: low metallicity; solid blue line: high metallicity) and to the best MIRI LRS model (solid light blue line), all shown at a resolution of 200. Key spectral features are highlighted in the corresponding colors.
Current usage metrics show cumulative count of Article Views (full-text article views including HTML views, PDF and ePub downloads, according to the available data) and Abstracts Views on Vision4Press platform.
Data correspond to usage on the plateform after 2015. The current usage metrics is available 48-96 hours after online publication and is updated daily on week days.
Initial download of the metrics may take a while.