| Issue |
A&A
Volume 702, October 2025
|
|
|---|---|---|
| Article Number | C4 | |
| Number of page(s) | 4 | |
| Section | Stellar structure and evolution | |
| DOI | https://doi.org/10.1051/0004-6361/202556991e | |
| Published online | 10 October 2025 | |
Contact tracing of binary stars: Pathways to stellar mergers (Corrigendum)
1
Heidelberger Institut für Theoretische Studien, Schloss-Wolfsbrunnenweg 35, 69118 Heidelberg, Germany
2
Zentrum für Astronomie der Universität Heidelberg, Astronomisches Rechen-Institut, Mönchhofstr. 12-14, 69120 Heidelberg, Germany
⋆ Corresponding author: This email address is being protected from spambots. You need JavaScript enabled to view it.
Key words: errata, addenda / methods: numerical / binaries: general / stars: evolution / stars: low-mass / stars: massive
1. Introduction
A typo in a program used to compute the birth probabilities pbirth of binary stars in Henneco et al. (2024) led to mistakes in the determination of the lower and upper integration boundaries (log Pl and log Pu, respectively) of the initial binary period Pi following Eq. (5) of that work. Instead of the proper integration interval for each model, this script used integration intervals with sizes of the order of those of the Case-A models. As a result, the integration intervals in log Pi of models of Case-B and Case-C systems were smaller than they should have been. The Case-B models are most affected by this mistake, since these models have the most widely spaced Pi values. We corrected this typo and recomputed our results that were derived using the birth probabilities, this time using the correct birth probabilities. We report these new results and the related figures and tables, and compare them to those originally reported in Henneco et al. (2024). To ease the use of these updated values, each of the figures and tables in this corrigendum has a reference to their original version. We discuss the updated results in sections with the same names as those in which they appear in Henneco et al. (2024). An exception is the appendix on the mass transfer efficiency (Appendix F in Henneco et al. 2024), which we include in this corrigendum as Sect. 3. While the previously reported incidences of evolutionary outcomes have changed quantitatively to a relatively small degree, our results and conclusions remain qualitatively the same.
2. Occurrence of contact phases
2.1. Population properties
We see from Figs. 1 and 2 that the incidence of mass-transferring Case-Be systems has increased with respect to the incidences reported in Henneco et al. (2024). This can be easily understood from the following two aspects. First, from Figs. 7, 8, B.1, and B.2 of Henneco et al. (2024), which show the occurrence of contact phases in terms of the initial mass ratio qi and initial binary separation ai, we find that for the majority of initial primary masses M1, i > 5 M⊙, the region of Case-Be systems is larger than the Case-A region. Second, since we assume a uniform initial distribution function for log Pi and qi, the birth probability of any region in the diagrams shown in Figs. 7, 8, B.1, B.2, and B.3 of Henneco et al. (2024) should be roughly proportional to its area. However, Figs. 10 and 11 in Henneco et al. (2024) report that the total incidence of mass-transferring Case-Be systems is roughly the same, or in some mass ranges even lower, than the total incidence of mass-transferring Case-A systems. With the corrected results, shown in Figs. 1 and 2, we see that the total incidence of Case-Be systems is now proportional to the sizes of the Case-Be regions in Figs. 7, 8, B.1, and B2 of Henneco et al. (2024).
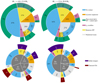 |
Fig. 1. Corrected version of Fig. 10 of Henneco et al. (2024): Sunburst charts displaying the fractions of evolutionary outcomes for mass-transferring binary systems in the grid over initial primary mass ranges of [4.8; 12.6) M⊙ (left) and [12.6; 20.8] M⊙ (right). Wedges with a percentage of < 1% are not labelled. Top row: The inner level shows the principal outcome of the evolution (‘Accretor expansion’, ‘Runaway MT’, ‘L2-overflow’, and ‘No contact’), while the outer level shows the ancillary outcome (‘L2-overflow’ and ‘Non-conservative MT + cannot eject’). Ancillary ‘No contact’ outcomes are incorporated in the inner ‘No contact’ category. Models in the ‘Numerical issues’ category are assigned a likely evolutionary outcome based on their initial mass ratio qi and mass-transfer case, displayed on the sunburst chart’s intermediate level. The labels ‘A’, ‘Be’, and ‘Bl/C’ refer to Case-A, Case-Be, and Case-Bl or -C mass transfer, respectively. Bottom row: The inner level shows the percentage of Case-A, Case-Be, Case-Bl, and Case-C systems. We show the principal outcome per case on the middle level. The outer level shows the lower limits of the total fraction of stellar mergers and classical CEs per mass-transfer case. |
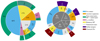 |
Fig. 2. Corrected version of Fig. 11 of Henneco et al. (2024): Sunburst charts displaying the fractions of evolutionary outcomes for mass-transferring binary systems in the grid over initial primary mass ranges of [4.8; 20.8] M⊙. The left and right charts are equivalent to those in the top and bottom row of Fig. 1, respectively. |
The remaining results described in Sect. 4.3 of Henneco et al. (2024) remain unchanged except for some relatively small differences in the incidences. We find that now the incidence of systems experiencing runaway mass transfer is only 2% higher in the M1, i ∈ [4.8; 12.6) M⊙ initial primary mass range than in the M1, i ∈ [12.6; 20.8] M⊙ range (before it was 5% higher). The systems with numerical issues that have runaway mass transfer as their most likely outcome have an incidence of 3 − 6% now. Before, this used to be 4 − 6%. Excluding the systems that run into numerical issues, we now find that ≥33% (instead of ≥41%) and ≥32% (instead of ≥34%) of mass-transferring binary systems enter a contact phase in the [4.8; 12.6) M⊙ and [12.6; 20.8] M⊙ mass ranges, respectively. Over the total mass range [4.8; 20.8] M⊙, the incidence of systems entering a contact phase is now ≥33% (instead of ≥40%). We arrived at these numbers by summing over the incidences of the ‘Accretor expansion’, ‘Runaway MT’, and ‘L2-overflow’ systems from the sunburst charts in the top row of Fig. 1 and the left panel of Fig. 2 for the respective mass ranges. Overall, we see that with the corrected birth probabilities, the incidences of contact phases are slightly lower than those in Henneco et al. (2024).
2.2. Stellar merger and classical CE incidence
Before we report the updated incidences of stellar mergers and classical common envelope (CE) phases, we note that we made one important change in our physical interpretation of the incidences of Case-Be mergers that is not related to the birth probabilities. Careful reinterpretation of our results has led us to conclude that all Case-Be systems that form contact binaries because of the expansion of the accretor will likely merge. Due to the rapid, thermal-timescale expansion of both components during this phase, it is unlikely that the resulting contact binary will be stable. This is in line with the interpretation used in follow-up work (Henneco et al., in prep.). Before, we only counted Case-Be systems that reach contact through runaway mass transfer and/or L2-overflow as stellar mergers. Adding this class of systems to the calculations of the incidences of stellar mergers increases them by 1 − 3%. With the corrected birth probabilities and the reinterpreted Case-Be systems, we now find that ≥16% (instead of ≥13%) of mass-transferring binaries with M1, i ∈ [4.8; 12.6) M⊙ produce stellar mergers. In the initial primary mass range of M1, i ∈ [12.6; 20.8] M⊙, ≥20% (instead of ≥12%) of mass-transferring systems produce stellar mergers. Over the whole mass range, that is M1, i ∈ [4.8; 20.8] M⊙, we now find that ≥16% of binaries are likely to merge, whereas this was ≥12% in Henneco et al. (2024). From Figs. 1 and 2 and Table 1, it is clear that the Case-Be systems now contribute more to the incidence of stellar mergers, as expected, when using the correct integration ranges. The corrected incidence of likely Case-A mergers in the [4.8; 20.8] M⊙ range of ≥6% is still in line with the ∼7% incidence of massive stars with strong, large-scale magnetic fields inferred by Donati & Landstreet (2009), Fossati et al. (2015), Grunhut et al. (2017), and Schöller et al. (2017). For the binaries entering a classical CE phase, the corrected incidences are ≥13%, ≥5%, and ≥12% (instead of ≥21%, ≥11%, and ≥19% in Henneco et al. 2024) for the [4.8; 12.6) M⊙, [12.6; 20.8] M⊙, and [4.8; 20.8] M⊙ ranges, respectively.
Corrected version of Table 1 of Henneco et al. (2024): Stellar merger and classical CE incidences and critical mass ratios qi, crit for mass-transferring binaries with M1, i ∈ [4.8; 20.8] M⊙.
Similar to Henneco et al. (2024), the lower limits on the classical CE incidences decrease with increasing initial primary mass, though they are now overall lower for the corrected birth probabilities (see Table 1). Whereas the stellar merger incidences remained relatively constant throughout the initial primary mass range in Table 1 of Henneco et al. (2024), we now see a larger spread – from ∼12% to ∼23% – in the updated Table 1.
2.3. Comparison with observed contact binaries
From the comparison between Fig. 3 and its original version, Fig. 12 in Henneco et al. (2024), we find that the probability distribution functions (PDFs) are almost unchanged when using the corrected pbirth. This is because the wrong integration ranges for log Pi used in Henneco et al. (2024) were all of the order of the integration ranges of Case-A systems, which are the systems included in the calculation of the PDFs. The most notable difference is the now larger contribution of Case-A runaway systems at low q. Such systems extend up to the border between Case-A and Case-Be systems and were more affected by the wrong log Pi integration ranges.
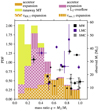 |
Fig. 3. Corrected version of Fig. 12 in Henneco et al. (2024): PDF of contact systems formed in Case-A binaries with M1, i = 4.8 − 20.8 M⊙ (this mass range was incorrectly stated as M1, i = 7.9 − 20.8 M⊙ in the original version of this figure) as a function of the mass ratio q at the onset of contact. Data points (filled squares) show the observed mass ratio and primary mass (right axis) for all observed Milky Way (MW) and Large and Small Magellanic Cloud (LMC and SMC) contact and near-contact systems from Ostrov (2001), Harries et al. (2003), Hilditch et al. (2005), Mahy et al. (2020), and Janssens et al. (2021), as compiled in Menon et al. (2021), including the uncertainties on their values. Systems without reported uncertainties on q are indicated with a dash symbol, and those without reported uncertainties on q and M1 are indicated with a star symbol. We also note that the range in PDF values (y-axis) has changed compared to the original figure due to a previous incorrect normalisation. |
3. Mass-transfer efficiency
We now compare Fig. 4 with its original counterpart, Fig. F.1 in Henneco et al. (2024). We find that the corrected mean mass-transfer efficiencies  are lower than or approximately equal to those reported in Henneco et al. (2024) for almost all mass-transfer cases and initial primary masses. Notable exceptions are Case-B and Case-C mass transfer for initial primary masses of 15.6 M⊙ and 16.9 M⊙. Here, the corrected
  are higher than the original by ∼0.10. In general, we find that the updated
  is lower by up to ∼0.10 for Case-A mass transfer and by up to ∼0.20 for Case-B and Case-C mass transfer. We stress that despite these relatively large absolute differences in
  for some primary masses, the overall trends in
  stay the same.
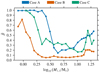 |
Fig. 4. Corrected version of Fig. F.1 of Henneco et al. (2024): Mean mass-transfer efficiency |

4. Conclusions
In this corrigendum, we point out a mistake made in the computation of the birth probabilities in Henneco et al. (2024) and describe how the corrected values for these birth probabilities affected our results. From these new results and the comparison with the originally reported ones, we conclude that despite changes in the calculated incidences of the different evolutionary outcomes, our original conclusions related to these incidences remain unchanged. These conclusions are that (1) we expect stellar mergers and classical CEs to be relatively common, with incidences of ≥16% and ≥12%, respectively, for binaries with initial primary masses between roughly 5 and 20 M⊙, (2) these incidences are lower limits, given the relatively low mass-transfer efficiencies in our models, and (3) our models can naturally explain the dearth of observed massive contact binaries with mass ratios approximately below 0.5.
Acknowledgments
We thank Utkarsh Basu for discovering the mistake.
References
- Donati, J. F., & Landstreet, J. D. 2009, ARA&A, 47, 333 [Google Scholar]
- Fossati, L., Castro, N., Schöller, M., et al. 2015, A&A, 582, A45 [NASA ADS] [CrossRef] [EDP Sciences] [Google Scholar]
- Grunhut, J. H., Wade, G. A., Neiner, C., et al. 2017, MNRAS, 465, 2432 [NASA ADS] [CrossRef] [Google Scholar]
- Harries, T. J., Hilditch, R. W., & Howarth, I. D. 2003, MNRAS, 339, 157 [Google Scholar]
- Henneco, J., Schneider, F. R. N., & Laplace, E. 2024, A&A, 682, A169 [NASA ADS] [CrossRef] [EDP Sciences] [Google Scholar]
- Hilditch, R. W., Howarth, I. D., & Harries, T. J. 2005, MNRAS, 357, 304 [NASA ADS] [CrossRef] [Google Scholar]
- Janssens, S., Shenar, T., Mahy, L., et al. 2021, A&A, 646, A33 [EDP Sciences] [Google Scholar]
- Mahy, L., Almeida, L. A., Sana, H., et al. 2020, A&A, 634, A119 [NASA ADS] [CrossRef] [EDP Sciences] [Google Scholar]
- Menon, A., Langer, N., de Mink, S. E., et al. 2021, MNRAS, 507, 5013 [NASA ADS] [CrossRef] [Google Scholar]
- Ostrov, P. G. 2001, MNRAS, 321, L25 [NASA ADS] [CrossRef] [Google Scholar]
- Schöller, M., Hubrig, S., Fossati, L., et al. 2017, A&A, 599, A66 [NASA ADS] [CrossRef] [EDP Sciences] [Google Scholar]
© The Authors 2025
 Open Access article, published by EDP Sciences, under the terms of the Creative Commons Attribution License (https://creativecommons.org/licenses/by/4.0), which permits unrestricted use, distribution, and reproduction in any medium, provided the original work is properly cited.
This article is published in open access under the Subscribe to Open model. This email address is being protected from spambots. You need JavaScript enabled to view it. to support open access publication.
All Tables
Corrected version of Table 1 of Henneco et al. (2024): Stellar merger and classical CE incidences and critical mass ratios qi, crit for mass-transferring binaries with M1, i ∈ [4.8; 20.8] M⊙.
All Figures
|
Fig. 1. Corrected version of Fig. 10 of Henneco et al. (2024): Sunburst charts displaying the fractions of evolutionary outcomes for mass-transferring binary systems in the grid over initial primary mass ranges of [4.8; 12.6) M⊙ (left) and [12.6; 20.8] M⊙ (right). Wedges with a percentage of < 1% are not labelled. Top row: The inner level shows the principal outcome of the evolution (‘Accretor expansion’, ‘Runaway MT’, ‘L2-overflow’, and ‘No contact’), while the outer level shows the ancillary outcome (‘L2-overflow’ and ‘Non-conservative MT + cannot eject’). Ancillary ‘No contact’ outcomes are incorporated in the inner ‘No contact’ category. Models in the ‘Numerical issues’ category are assigned a likely evolutionary outcome based on their initial mass ratio qi and mass-transfer case, displayed on the sunburst chart’s intermediate level. The labels ‘A’, ‘Be’, and ‘Bl/C’ refer to Case-A, Case-Be, and Case-Bl or -C mass transfer, respectively. Bottom row: The inner level shows the percentage of Case-A, Case-Be, Case-Bl, and Case-C systems. We show the principal outcome per case on the middle level. The outer level shows the lower limits of the total fraction of stellar mergers and classical CEs per mass-transfer case. |
| In the text | |
|
Fig. 2. Corrected version of Fig. 11 of Henneco et al. (2024): Sunburst charts displaying the fractions of evolutionary outcomes for mass-transferring binary systems in the grid over initial primary mass ranges of [4.8; 20.8] M⊙. The left and right charts are equivalent to those in the top and bottom row of Fig. 1, respectively. |
| In the text | |
|
Fig. 3. Corrected version of Fig. 12 in Henneco et al. (2024): PDF of contact systems formed in Case-A binaries with M1, i = 4.8 − 20.8 M⊙ (this mass range was incorrectly stated as M1, i = 7.9 − 20.8 M⊙ in the original version of this figure) as a function of the mass ratio q at the onset of contact. Data points (filled squares) show the observed mass ratio and primary mass (right axis) for all observed Milky Way (MW) and Large and Small Magellanic Cloud (LMC and SMC) contact and near-contact systems from Ostrov (2001), Harries et al. (2003), Hilditch et al. (2005), Mahy et al. (2020), and Janssens et al. (2021), as compiled in Menon et al. (2021), including the uncertainties on their values. Systems without reported uncertainties on q are indicated with a dash symbol, and those without reported uncertainties on q and M1 are indicated with a star symbol. We also note that the range in PDF values (y-axis) has changed compared to the original figure due to a previous incorrect normalisation. |
| In the text | |
|
Fig. 4. Corrected version of Fig. F.1 of Henneco et al. (2024): Mean mass-transfer efficiency |
| In the text | |
Current usage metrics show cumulative count of Article Views (full-text article views including HTML views, PDF and ePub downloads, according to the available data) and Abstracts Views on Vision4Press platform.
Data correspond to usage on the plateform after 2015. The current usage metrics is available 48-96 hours after online publication and is updated daily on week days.
Initial download of the metrics may take a while.