| Issue |
A&A
Volume 702, October 2025
|
|
|---|---|---|
| Article Number | C2 | |
| Number of page(s) | 4 | |
| Section | Extragalactic astronomy | |
| DOI | https://doi.org/10.1051/0004-6361/202557073e | |
| Published online | 30 September 2025 | |
JWST Observations of Starbursts: Relations between PAH features and CO clouds in the starburst galaxy M 82 (Corrigendum)
1
Departamento de Astronomía, Universidad de Concepción, Barrio Universitario, Concepción, Chile
2
Department of Astronomy, University of Maryland, College Park, MD 20742, USA
3
Space Telescope Science Institute, 3700 San Martin Drive, Baltimore, MD 21218, USA
4
Centre for Astrophysics and Supercomputing, Swinburne University of Technology, Hawthorn, VIC 3122, Australia
5
ARC Centre of Excellence for All Sky Astrophysics in 3 Dimensions (ASTRO 3D)
6
Department of Astronomy, The Ohio State University, Columbus, OH 43210, USA
7
IPAC, California Institute of Technology, 1200 E. California Blvd., Pasadena, CA 91125, USA
8
Department of Physics & Astronomy, University of Wyoming, Laramie, WY 82071, USA
9
Sterrenkundig Observatorium, Ghent University, Krijgslaan 281 – S9, B9000 Ghent, Belgium
10
Departamento Física Teórica y del Cosmos, Universidad de Granada, E-18071 Granada, Spain
11
Instituto Universitario Carlos I de Física Teórica y Computacional, Universidad de Granada, E-18071 Granada, Spain
12
European Space Agency, c/o STScI, 3700 San Martin Drive, Baltimore, MD 21218, USA
13
Leiden Observatory, Leiden University, P.O. Box 9513 2300 RA, Leiden, The Netherlands
14
National Radio Astronomy Observatory, P.O. Box O 1003 Lopezville Road, Socorro, NM 87801, USA
15
New Mexico Institute of Mining and Technology, 801 Leroy Place, Socorro, NM 87801, USA
16
IPAC, California Institute of Technology, 1200 E. California Blvd., Pasadena, CA 91125, USA
17
National Radio Astronomy Observatory, 520 Edgemont Road, Charlottesville, VA 22903, USA
18
Millenium Nucleus for Galaxies (MINGAL), Chile
19
Ritter Astrophysical Research Center, University of Toledo, Toledo, OH 43606, USA
20
Center for Cosmology and Astro-Particle Physics, The Ohio State University, Columbus, OH 43210, USA
21
Max-Planck-Institut für Astronomie, Königstuhl 17, 69117 Heidelberg, Germany
⋆⋆ Corresponding author: This email address is being protected from spambots. You need JavaScript enabled to view it.
Key words: errata, addenda / galaxies: ISM / quasars: emission lines / galaxies: starburst
CATA Postdoctoral Fellow.
1. Introduction
This erratum addresses the incorrect derivation of the CO(1-0) intensity map originally included in Villanueva et al. (2025), which did not consider the proper combination of the Northern Extended Millimetre Array (NOEMA) inteferometric CO(1-0) data with available Institut de radioastronomie millimétrique (IRAM) 30 m CO(1-0) observations (as originally included in Krieger et al. 2021). With the inclusion of the new, well-combined full set of the CO(1-0) emission line data, fluxes of the CO clouds are ∼1.0–1.5 orders of magnitude higher than in the previous version.
The revision impacts some aspects regarding the number of cloud-like structures identified, best-linear fit parameters, and conclusions. As a consequence, figures and equations have been updated according to the new version of the CO data presented here; on average, the results are in agreement with both those included in Villanueva et al. (2025) and similar upcoming studies (e.g., Lopez et al. in prep.).
2. Updated sections
2.1. Abstract
To perform our analysis, we identified CO clouds using the archival 12CO(J = 1-0) NOEMA+IRAM moment 0 map within 2 kpc of the center of M 82, with sizes ranging between ∼31 and 400 pc. Then, we computed the CO-to-polycyclic aromatic hydrocarbon (PAH) relations for the 413 validated CO clouds.
2.2. CO NOEMA data
As explained in Lopez et al. (in prep.), the CO(1-0) data include both IRAM 30 m single-dish and NOEMA interferometric observations originally included in Krieger et al. (2021). Briefly, the two datasets were first combined using the Common Astronomy Software Applications (CASA) task feather to ensure that the final products include zero spacing data, and then convolved to obtain a round synthesized beam. Finally, the CO intensity map (moment 0) was produced by integrating the emission comprised in velocity-range based masks constructed from Karl Jansky Very Large Array (VLA) 21 cm emission line observations (Martini et al. 2018), and both archival IRAM 30 m CO(2-1) map (Leroy et al. 2015) and CO(1-0) data (Krieger et al. 2021). This resulted in a 2.2″ resolution CO(1-0) intensity map that covers the inner ∼2 kpc of the starburst galaxy M 82 (see the left panel of Fig. 1).
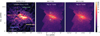 |
Fig. 1. Corrected M 82 CO(J = 1-0) map derived by combining IRAM observations with NOEMA observations (left), MIRI-F770W images (middle), and MIRI-F1130W images (right) in cutouts of 5′×4.2′. The new version of the left panel contains the updated set of 413 CO clouds identified here (white contours). |
2.3. Cloud identification
Using the new version of the CO(1-0) intensity map and QUICKCLUMP1 (Sidorin 2017), and following the procedure described in Sect. 2.2 and Appendix B in Villanueva et al. (2025), we validated 413 CO clouds (white contours in the left panel of Fig. 1); their sizes range between ∼31 and 400 pc (see Fig. 2). We now find larger CO cloud sizes than in the original study (57.6 versus 41.3 pc).
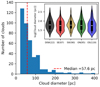 |
Fig. 2. Distribution of sizes of the 413 CO clouds we identified in the updated NOEMA+IRAM map using QUICKCLUMP. |
We obtain the following updated distributions: disk (DISK; 22 clouds), streamer east (SE; 87 clouds), streamer west (SW; 90 clouds), outflow north (ON; 95 clouds), and outflow south (OS; 119 clouds).
2.4. CO versus PAH relations
We computed the relations between CO and mid-IR PAH emission for the 413 molecular clouds identified in Sect. 2.3. The new best-linear fit relation for the data binned in IMIRI770 values is given by
![Mathematical equation: $$ \begin{aligned} \log (I_{\rm CO(1-0)}/[\mathrm{K \, km/s}]) = (0.59 \pm 0.16)\times&\log (I_{\rm MIRI770} /[\mathrm{MJy \, sr^{-1}}])\nonumber \\&- (0.92 \pm 0.32). \end{aligned} $$](/articles/aa/full_html/2025/10/aa57073e-25/aa57073e-25-eq1.gif) (1)
(1)
We note that the slope for the entire cloud sample is slightly lower than that of the previous version (m = 0.74 ± 0.19), although still within the uncertainties. However, we obtain different Pearson rp values for the CO-F770W relation when dividing the cloud sample by regions. While the CO-F770W relation is still tight in the disk, ON and OS (rp ∼ 0.7 − 0.9), the rest of the groups now have significantly lower rp values (with an almost null correlation for SE; see Table 1).
The bottom-left panel of Fig. 3 shows the new version of the ICO(1 − 0)-F1130W relation. We computed the updated best-linear relation for the data binned in IMIRI1130 values as follows:
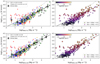 |
Fig. 3. Updated version of the relations between ICO(1 − 0) versus IMIRI770 (top), and IMIRI1130 (bottom). |
New correlation coefficients for the relations between CO and F770W, F1130W, and F770W/F1130W.
![Mathematical equation: $$ \begin{aligned} \log (I_{\rm CO(1-0)}/[\mathrm{K \, km/s}]) = (0.68 \pm 0.16)\times&\log (I_{\rm MIRI1130} /[\mathrm{MJy \, sr^{-1}}])\nonumber \\&- (0.91 \pm 0.34). \end{aligned} $$](/articles/aa/full_html/2025/10/aa57073e-25/aa57073e-25-eq2.gif) (2)
(2)
We note that the CO-F1130W best fit has a slightly lower slope compared to that found in the previous version (m = 0.8 ± 0.25). Likewise, when splitting the clouds into the regions of M 82, we find that the updated CO-F1130W relation remains only tight for ON; the rest of the groups have a poor or null correlation (see Table 1).
When we compare the x0 = −b/m values (i.e., the x value where the best linear relation intercepts the x-axis) for the two relations with the previous versions, we find that M 82 now has slightly higher x0 values (∼1.1–1.2 times higher than those for PHANGS galaxies). Although now there are smaller discrepancies in the linear parameters for the CO-F770W and CO-F1130W relations in the Physics at High Angular resolution in Nearby GalaxieS (PHANGS) survey and M 82, they still appear to reflect differences in the mechanisms of PAH emission.
The right panels of Fig. 3 show that we still find tighter CO-F770W (top) and CO-F1130W (bottom) relations in clouds larger than 100 pc (now the Pearson rp ∼ 0.5 − 0.6; previously was rp ∼ 0.7) compared to those with shorter diameters (now is ≲0.3 compared to ∼0.1–0.4). The updated results still indicate that larger clouds have more significant CO detections than smaller structures.
2.5. CO versus F770W/F1130W
The top panel of Fig. 4 presents the new relation between CO and the IMIRI770/IMIRI1130 ratio. Interestingly, the CO-F770W/F1130W relation is now tighter for the disk and ON than in the previous version (rp ≳ 0.5 − 0.7). When analyzing the projected distances of the CO clouds with respect to the optical center (bottom panel), we note that now small clouds (≲50 pc) from both SE and SW (i.e., those with low rp in the top panel of Fig. 4), and at distances greater than 1 kpc from the optical center contribute significantly to the scatter of the CO-F770W/F1130W relation at log(IMIRI770/IMIRI1130) ∼ 0.56.
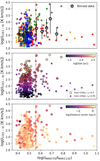 |
Fig. 4. New version of the ICO(1 − 0) versus IMIRI770/IMIRI1130 ratio. |
In summary, despite a rescaling of the integrated fluxes of the CO line for the new set of 413 clouds identified, our new results are on average in agreement with the main findings included in Villanueva et al. (2025) and the upcoming follow-up studies based on the CO-PAH relations in M 82 (e.g., Lopez et al. in prep.).
References
- Krieger, N., Walter, F., Bolatto, A. D., et al. 2021, ApJ, 915, L3 [NASA ADS] [CrossRef] [Google Scholar]
- Leroy, A. K., Walter, F., Martini, P., et al. 2015, ApJ, 814, 83 [Google Scholar]
- Martini, P., Leroy, A. K., Mangum, J. G., et al. 2018, ApJ, 856, 61 [Google Scholar]
- Sidorin, V. 2017, Quickclump: Identify clumps within a 3D FITS datacube, Astrophysics Source Code Library [record ascl:1704.006] [Google Scholar]
- Villanueva, V., Bolatto, A. D., Herrera-Camus, R., et al. 2025, A&A, 695, A202 [NASA ADS] [CrossRef] [EDP Sciences] [Google Scholar]
© The Authors 2025
 Open Access article, published by EDP Sciences, under the terms of the Creative Commons Attribution License (https://creativecommons.org/licenses/by/4.0), which permits unrestricted use, distribution, and reproduction in any medium, provided the original work is properly cited.
This article is published in open access under the Subscribe to Open model. This email address is being protected from spambots. You need JavaScript enabled to view it. to support open access publication.
All Tables
New correlation coefficients for the relations between CO and F770W, F1130W, and F770W/F1130W.
All Figures
|
Fig. 1. Corrected M 82 CO(J = 1-0) map derived by combining IRAM observations with NOEMA observations (left), MIRI-F770W images (middle), and MIRI-F1130W images (right) in cutouts of 5′×4.2′. The new version of the left panel contains the updated set of 413 CO clouds identified here (white contours). |
| In the text | |
|
Fig. 2. Distribution of sizes of the 413 CO clouds we identified in the updated NOEMA+IRAM map using QUICKCLUMP. |
| In the text | |
|
Fig. 3. Updated version of the relations between ICO(1 − 0) versus IMIRI770 (top), and IMIRI1130 (bottom). |
| In the text | |
|
Fig. 4. New version of the ICO(1 − 0) versus IMIRI770/IMIRI1130 ratio. |
| In the text | |
Current usage metrics show cumulative count of Article Views (full-text article views including HTML views, PDF and ePub downloads, according to the available data) and Abstracts Views on Vision4Press platform.
Data correspond to usage on the plateform after 2015. The current usage metrics is available 48-96 hours after online publication and is updated daily on week days.
Initial download of the metrics may take a while.