| Issue |
A&A
Volume 702, October 2025
|
|
|---|---|---|
| Article Number | C1 | |
| Number of page(s) | 1 | |
| Section | Interstellar and circumstellar matter | |
| DOI | https://doi.org/10.1051/0004-6361/202557110e | |
| Published online | 30 September 2025 | |
Extended atomic carbon around molecular clouds (Corrigendum)
1
Universität zu Köln, I. Physikalisches Institut,
Zülpicher Str. 77,
50937
Köln,
Germany
2
Max-Planck-Insitut für Radioastronomie,
Auf dem Hügel 69,
53121
Bonn,
Germany
3
Institute of Astronomy, Faculty of Physics, Astronomy and Informatics, Nicolaus Copernicus University,
Grudziądzka 5,
87-100
Toruń,
Poland
4
INAF – Istituto di Astrofisica e Planetologia Spaziali,
Via Fosso del Cavaliere 100,
00133
Roma,
Italy
5
Argelander-Institut für Astronomie, Universität Bonn,
Auf dem Hügel 71,
53121
Bonn,
Germany
★ Corresponding author: This email address is being protected from spambots. You need JavaScript enabled to view it.
Key words: ISM: clouds / ISM: molecules / ISM: structure / Galaxy: abundances / submillimeter: ISM / errata, addenda
The analytic computation of the column densities for the model clumps in the photon-dominated region (PDR) modeling in Sect. 5.3 used an incorrect clump mass-to-column conversion, dividing by the clump radius instead of the square of the clump radius. Consequently, Figs. 9 and B.1, which normalize the intensities by the gas column density and indicate the parameter range of the observed column densities, were wrong. The corrected figures (Figs. 1 and 2 here) show the correct steeper contours of constant column density in the density-mass parameter space.
With the correct column densities a limitation of the observed data to CO, [C I], [C II], and the total gas column results in a solution space between low-mass clumps with densities of about 105 cm−3 and ten times thinner clumps of about one solar mass. However, our main conclusion is confirmed: that when including the information from 13CO 2-1 and C18O 2-1, all models are ruled out. The specific intensities of those two lines are only met for low-mass, low-density or high-mass, high-density clumps. Both are incompatible with the observational data of CO and [C I]. The correct normalization still shows no parameter space that matches all observed intensities, even within a factor of ten.
© The Authors 2025
 Open Access article, published by EDP Sciences, under the terms of the Creative Commons Attribution License (https://creativecommons.org/licenses/by/4.0), which permits unrestricted use, distribution, and reproduction in any medium, provided the original work is properly cited.
This article is published in open access under the Subscribe to Open model. This email address is being protected from spambots. You need JavaScript enabled to view it. to support open access publication.
All Figures
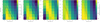 |
Fig. 1 Integrated line intensities predicted by the KOSMA-τ PDR model relative to the column density of the model clumps for a UV radiation field of 1χ0. The panels from left to right show CO 2-1, 13CO 2-1, C18O 2-1, [C I] 1-0, and [C II]. The white, gray, and black lines indicate the minimum, mean, and maximum of the observed ratio. For [C II] we only have an upper limit. The red and orange contours indicate the lowest and highest column density in the region obtained from the dust observations. |
| In the text | |
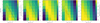 |
Fig. 2 Same as Fig. 1 but for a UV radiation field of 10χ0. |
| In the text | |
Current usage metrics show cumulative count of Article Views (full-text article views including HTML views, PDF and ePub downloads, according to the available data) and Abstracts Views on Vision4Press platform.
Data correspond to usage on the plateform after 2015. The current usage metrics is available 48-96 hours after online publication and is updated daily on week days.
Initial download of the metrics may take a while.