Open Access
Fig. 1.
Download original image
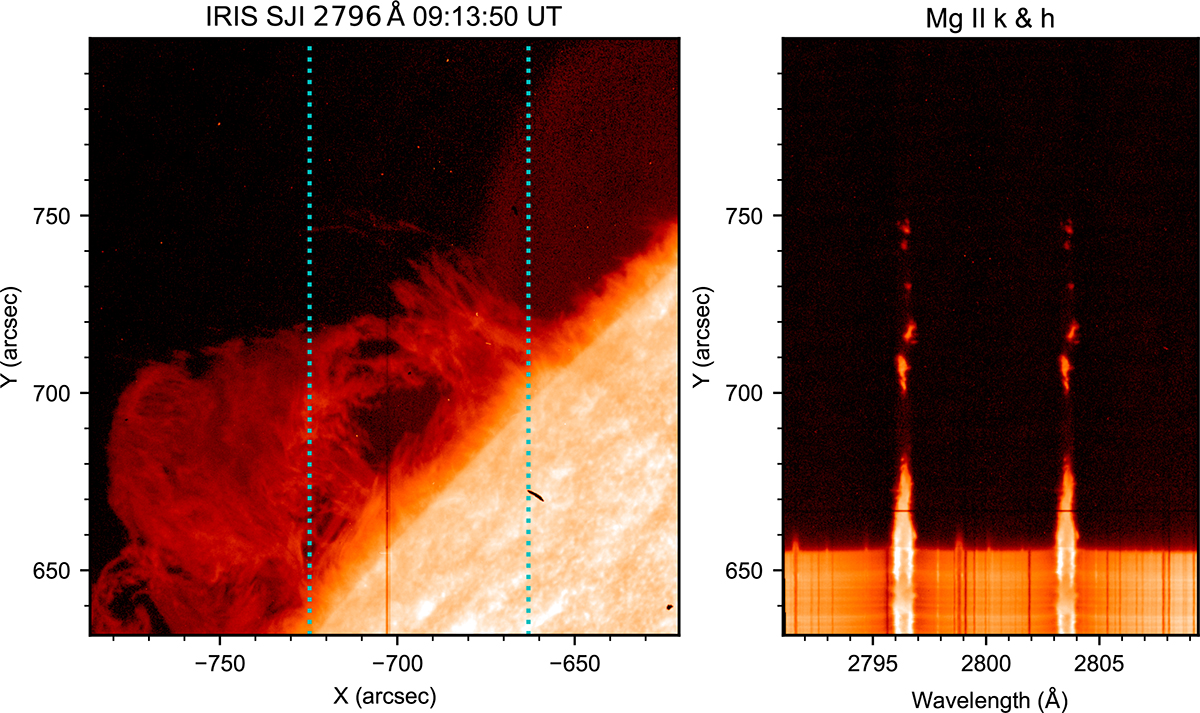
Example of IRIS observations. Left: IRIS SJI in 2796 Å. The dark line in the center corresponds to the position of the spectrograph slit, and the dotted cyan lines mark the two extreme positions of the slit. Right: Mg II k&h spectra taken along the slit in (a). Both the two images are shown in logarithmic scale.
Current usage metrics show cumulative count of Article Views (full-text article views including HTML views, PDF and ePub downloads, according to the available data) and Abstracts Views on Vision4Press platform.
Data correspond to usage on the plateform after 2015. The current usage metrics is available 48-96 hours after online publication and is updated daily on week days.
Initial download of the metrics may take a while.