Fig. 10.
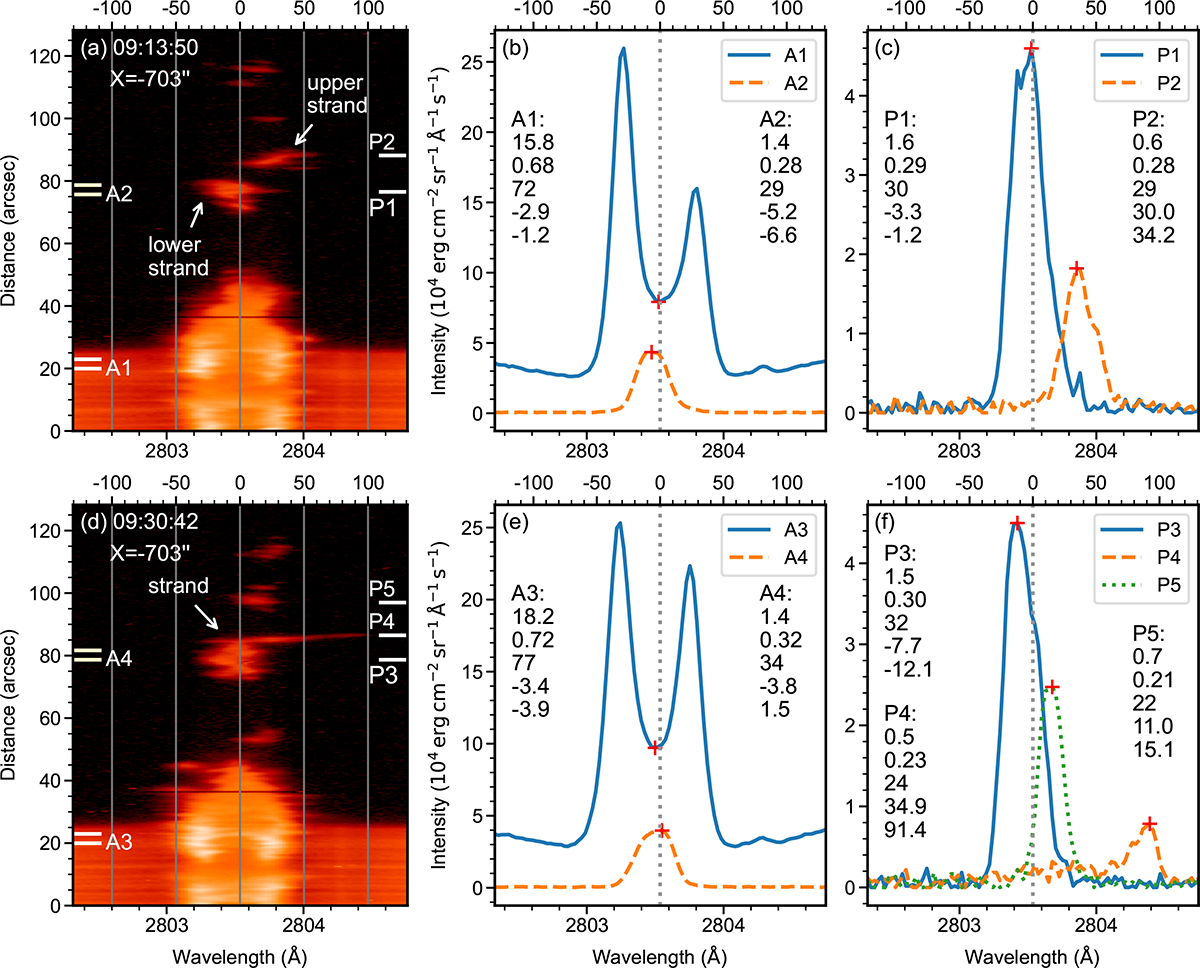
Download original image
Spectral observations of the Mg II h line. (a) and (d): Stigmatic spectral image. The left bars mark the limits for calculating averaged spectral profiles, and the right bars mark the position of spectral profiles from single spatial pixel. (b) and (e): Averaged profiles. (c) and (f): Profiles from single spatial pixel. The marked profile characters include integrated intensities in 104 erg cm−2 sr−1 s−1, FWHMs in Å, FWHMs in km s−1, LOS velocities by gravity center method in km s−1, and LOS velocities by profile centers identified by peaks or valleys in km s−1, which are marked with red pluses.
Current usage metrics show cumulative count of Article Views (full-text article views including HTML views, PDF and ePub downloads, according to the available data) and Abstracts Views on Vision4Press platform.
Data correspond to usage on the plateform after 2015. The current usage metrics is available 48-96 hours after online publication and is updated daily on week days.
Initial download of the metrics may take a while.