Fig. 15.
Download original image
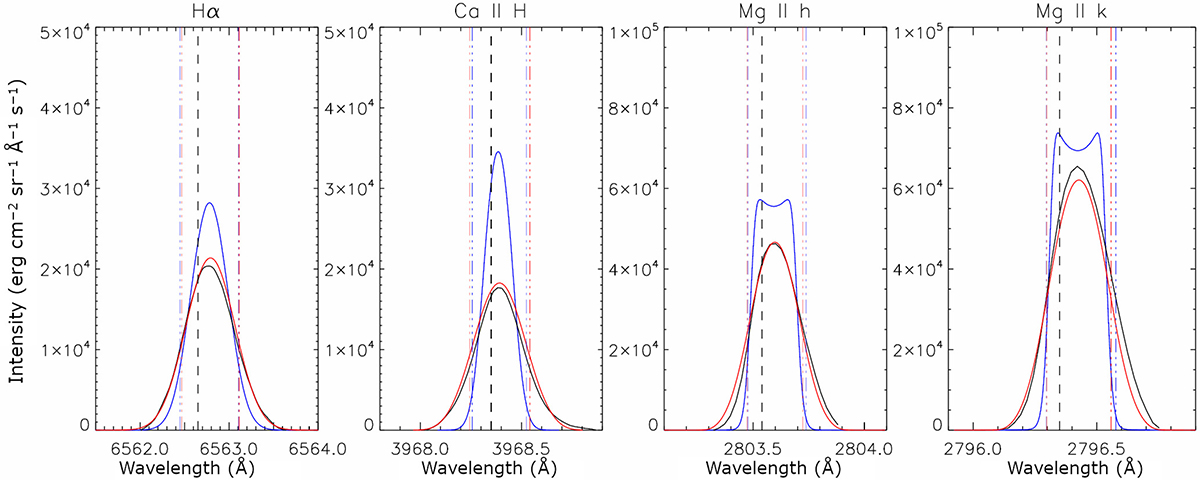
Comparison of the observed and modeled profiles at (–725″, 672″). The black lines show the observed profiles, the blue lines show the modeled profiles, the red lines show the modeled profiles convolved with a macro-velocity of 20 km s−1, and the vertical dash-dotted lines show the FWHM positions of each modeled profile. The vertical dashed lines show the position of the line center at rest wavelength.
Current usage metrics show cumulative count of Article Views (full-text article views including HTML views, PDF and ePub downloads, according to the available data) and Abstracts Views on Vision4Press platform.
Data correspond to usage on the plateform after 2015. The current usage metrics is available 48-96 hours after online publication and is updated daily on week days.
Initial download of the metrics may take a while.