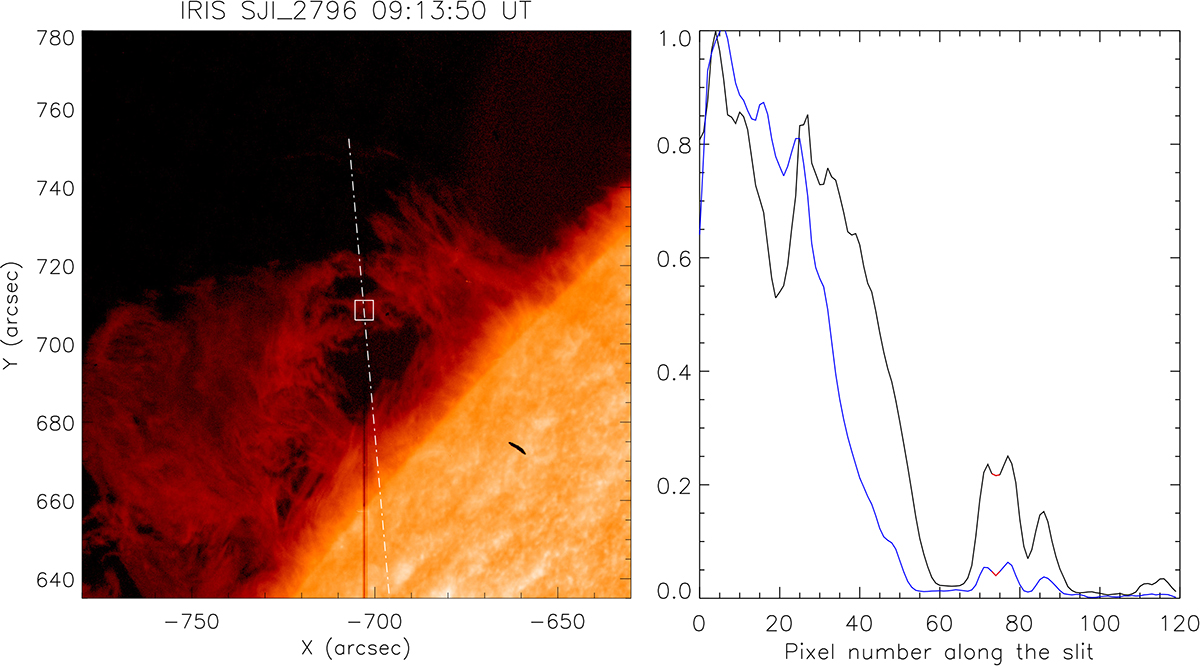
Fig. 2.
Download original image
Coalignment between the IRIS and SUMER observations. The dash-dotted line in the left panel in white represents the position of the SUMER slit. The right panel shows how the normalized integrated intensity changes along the slit. The blue line corresponds to the intensity of the pixels of the IRIS SJI along the white line from the bottom to the top. The black line corresponds to the Lyα integrated intensity at 09:13:33 UT along the SUMER slit.
Current usage metrics show cumulative count of Article Views (full-text article views including HTML views, PDF and ePub downloads, according to the available data) and Abstracts Views on Vision4Press platform.
Data correspond to usage on the plateform after 2015. The current usage metrics is available 48-96 hours after online publication and is updated daily on week days.
Initial download of the metrics may take a while.