Open Access
Fig. 8.
Download original image
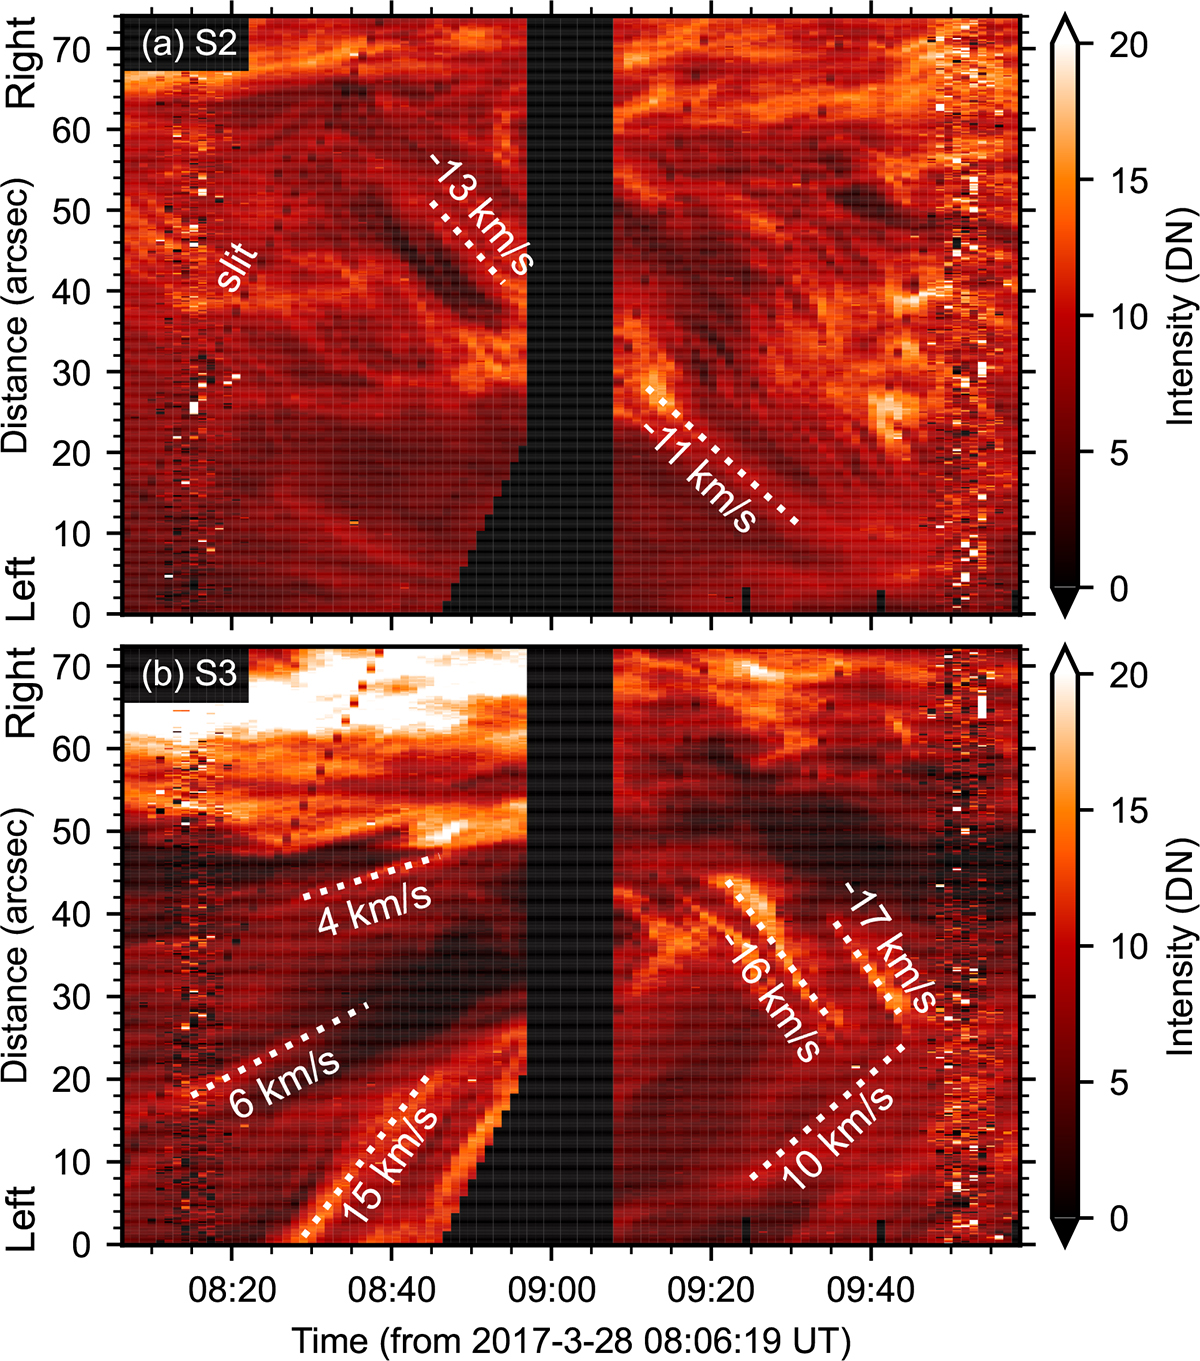
Time-distance diagrams of IRIS SJI 2796 Å along slices S2 and S3, as marked in Fig. 7a. Some flows are identified with their velocities marked. Note that the spectrograph slit can be seen as dark dotted features along straight lines.
Current usage metrics show cumulative count of Article Views (full-text article views including HTML views, PDF and ePub downloads, according to the available data) and Abstracts Views on Vision4Press platform.
Data correspond to usage on the plateform after 2015. The current usage metrics is available 48-96 hours after online publication and is updated daily on week days.
Initial download of the metrics may take a while.