Fig. 12
Download original image
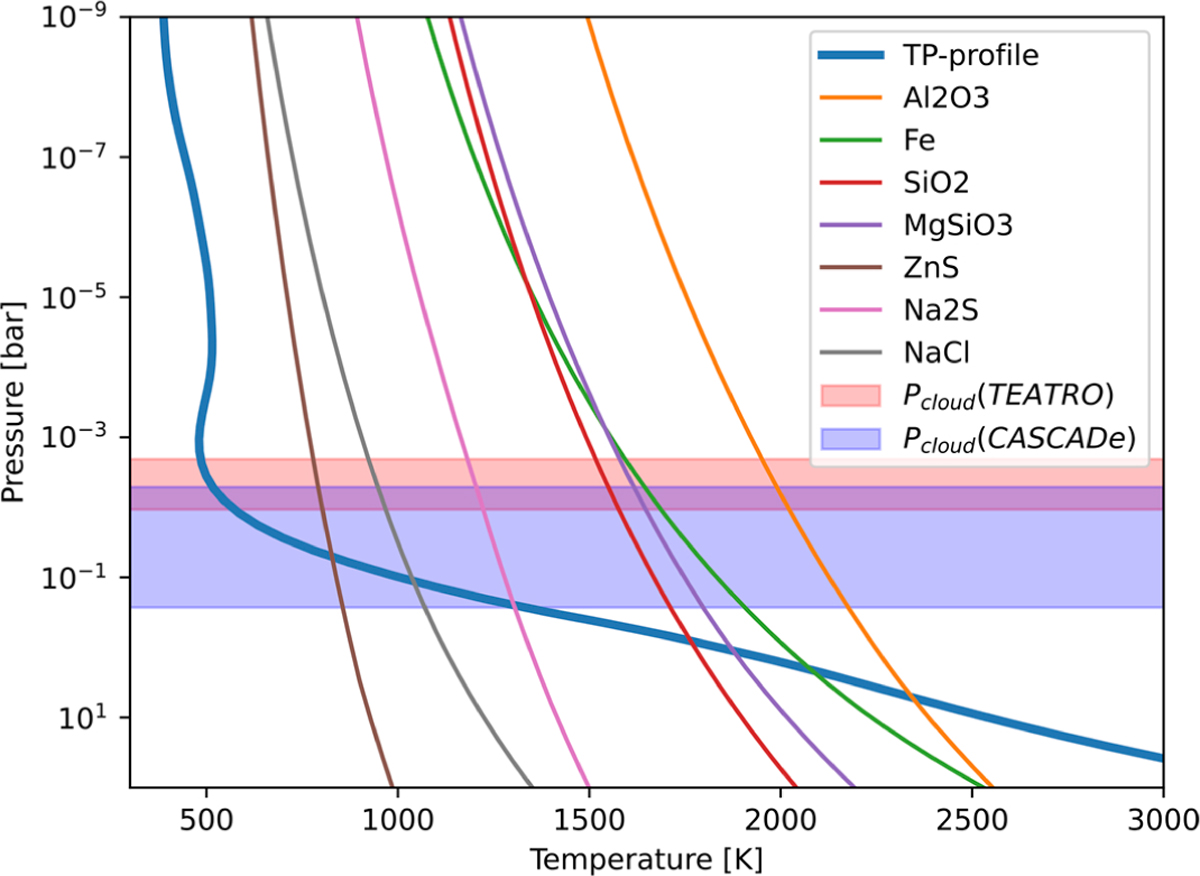
Condensation curves of several potential cloud-forming species (thin coloured lines) overplotted on the P−T profile from the radiative-convective equilibrium model (thick blue line). The condensation curves assume a gas with 10× solar metallicity. The shaded areas are the cloud pressure one-sigma ranges derived from the retrievals using the TEATRO reduction (pink) and the CASCADe reduction (blue).
Current usage metrics show cumulative count of Article Views (full-text article views including HTML views, PDF and ePub downloads, according to the available data) and Abstracts Views on Vision4Press platform.
Data correspond to usage on the plateform after 2015. The current usage metrics is available 48-96 hours after online publication and is updated daily on week days.
Initial download of the metrics may take a while.