Fig. 2
Download original image
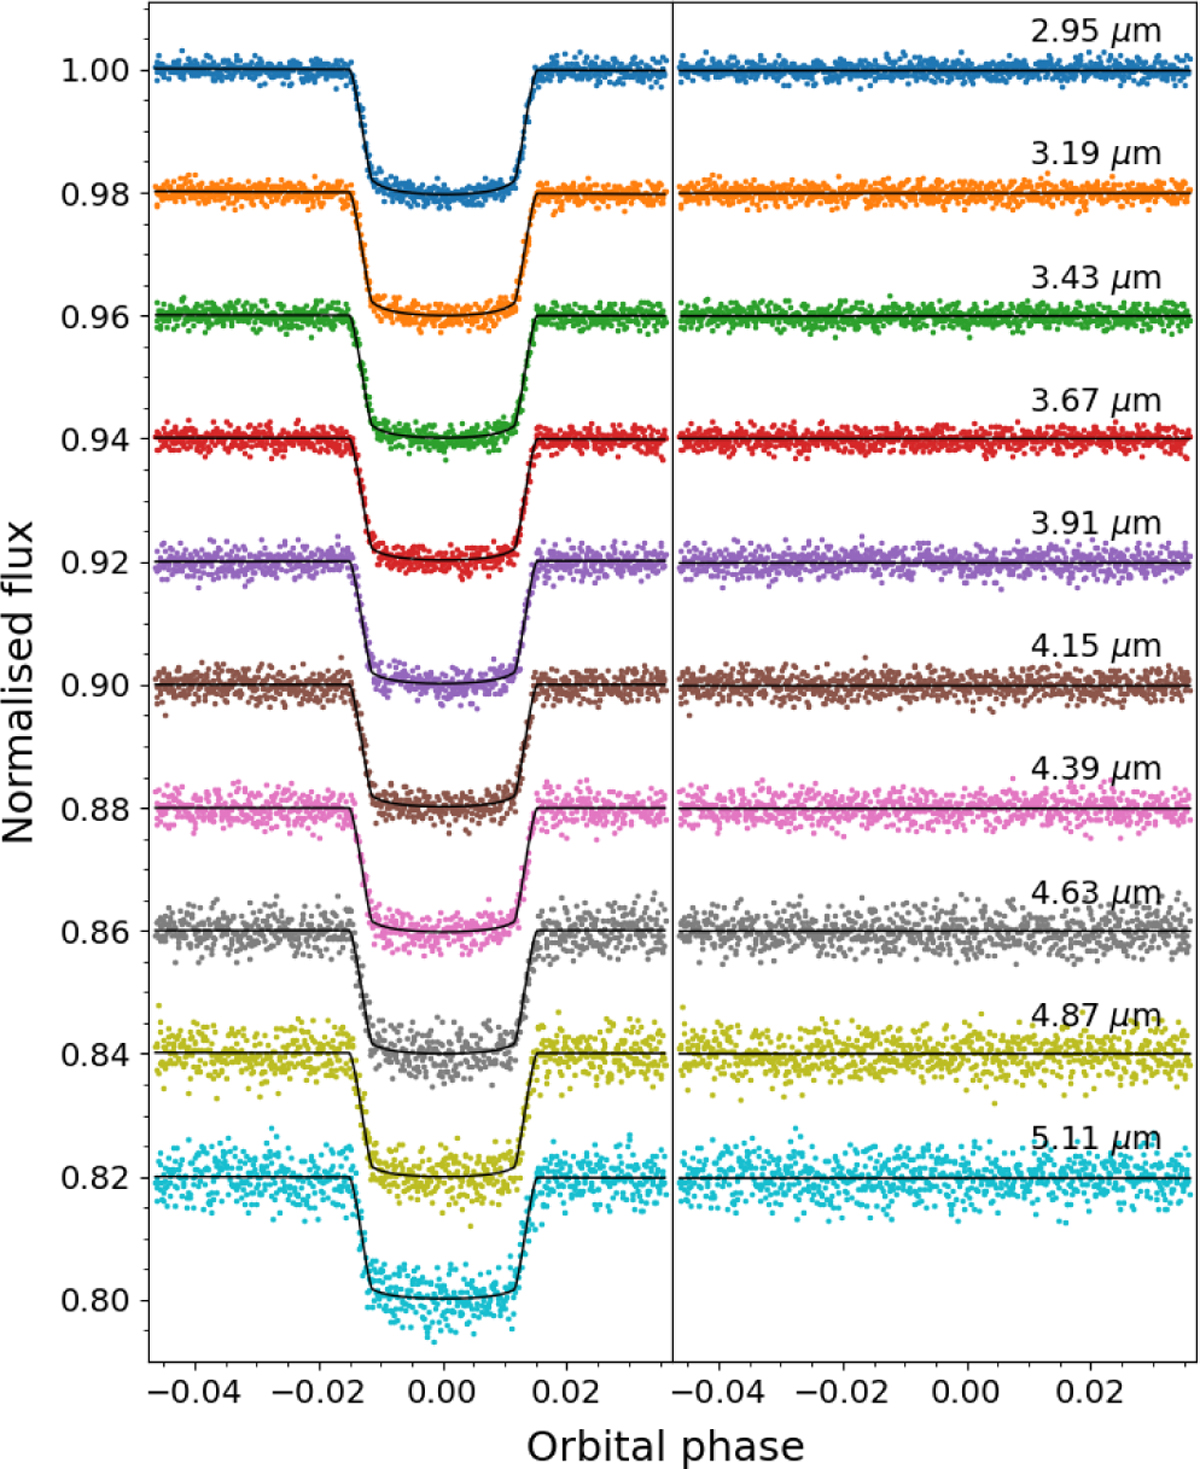
Sample of ten light curves out of 117 distributed over the 2.85–5.17 µm wavelength range. Each light curve covers a 0.02 µm wavelength bin. Left: transit light curves (coloured points) and best-fit models (black lines). Right: residuals. The central wavelength of each bin is indicated on the right. Systematic trends have not been removed in the left panel and are extremely small. These light curves were obtained with the TEATRO reduction. The light curves are offset for clarity.
Current usage metrics show cumulative count of Article Views (full-text article views including HTML views, PDF and ePub downloads, according to the available data) and Abstracts Views on Vision4Press platform.
Data correspond to usage on the plateform after 2015. The current usage metrics is available 48-96 hours after online publication and is updated daily on week days.
Initial download of the metrics may take a while.