Open Access
Fig. 4
Download original image
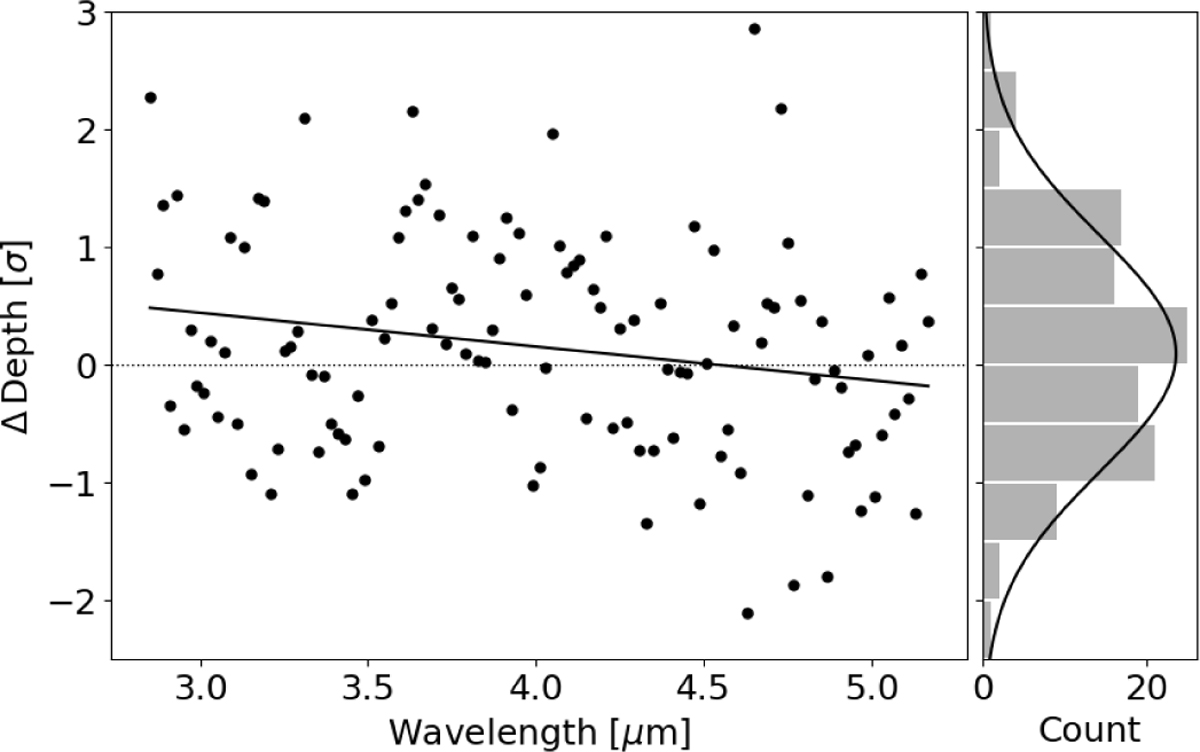
Left panel: transit depth difference between the CASCADe and TEATRO data reductions expressed in number of standard deviations σ as computed from Eq. (1), and best linear fit. Right panel: histogram of that distribution, and best Gaussian fit.
Current usage metrics show cumulative count of Article Views (full-text article views including HTML views, PDF and ePub downloads, according to the available data) and Abstracts Views on Vision4Press platform.
Data correspond to usage on the plateform after 2015. The current usage metrics is available 48-96 hours after online publication and is updated daily on week days.
Initial download of the metrics may take a while.