Fig. 5
Download original image
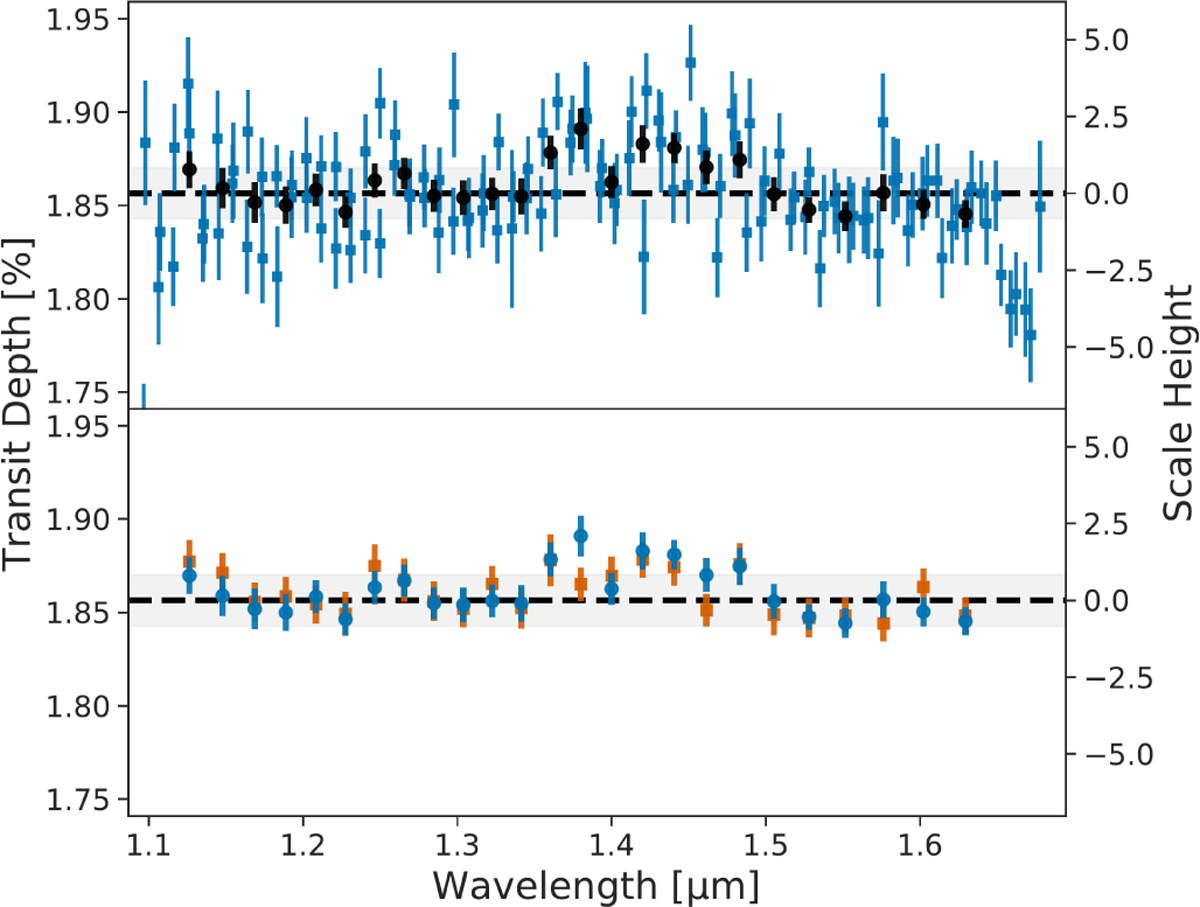
Transmission spectrum of HAT-P-12 b obtained with HST WFC3 G141 using our CASCADe reduction. The top panel shows the spectra for the two observed transits (blue squares) and the combined spectrum binned to a uniform spectral resolution of 0.02 µm (black dots). The bottom panel shows a comparison of the spectrum derived in this study (blue dots) and the one derived by Tsiaras et al. (2018) (orange squares). In both panels, the band-averaged transit depth is indicated by the dashed horizontal line, and the shaded area represents its 95% confidence interval. The spectrum from Tsiaras et al. (2018) has been shifted downwards by 150 ppm to the same mean transit depth as found by CASCADe, for better comparison. The y-axis on the right is in units of planetary atmospheric scale height assuming a hydrogen-dominated atmosphere and an equilibrium temperature of ~500 K as derived from the ARCiS retrieval.
Current usage metrics show cumulative count of Article Views (full-text article views including HTML views, PDF and ePub downloads, according to the available data) and Abstracts Views on Vision4Press platform.
Data correspond to usage on the plateform after 2015. The current usage metrics is available 48-96 hours after online publication and is updated daily on week days.
Initial download of the metrics may take a while.