Open Access
Fig. 1.
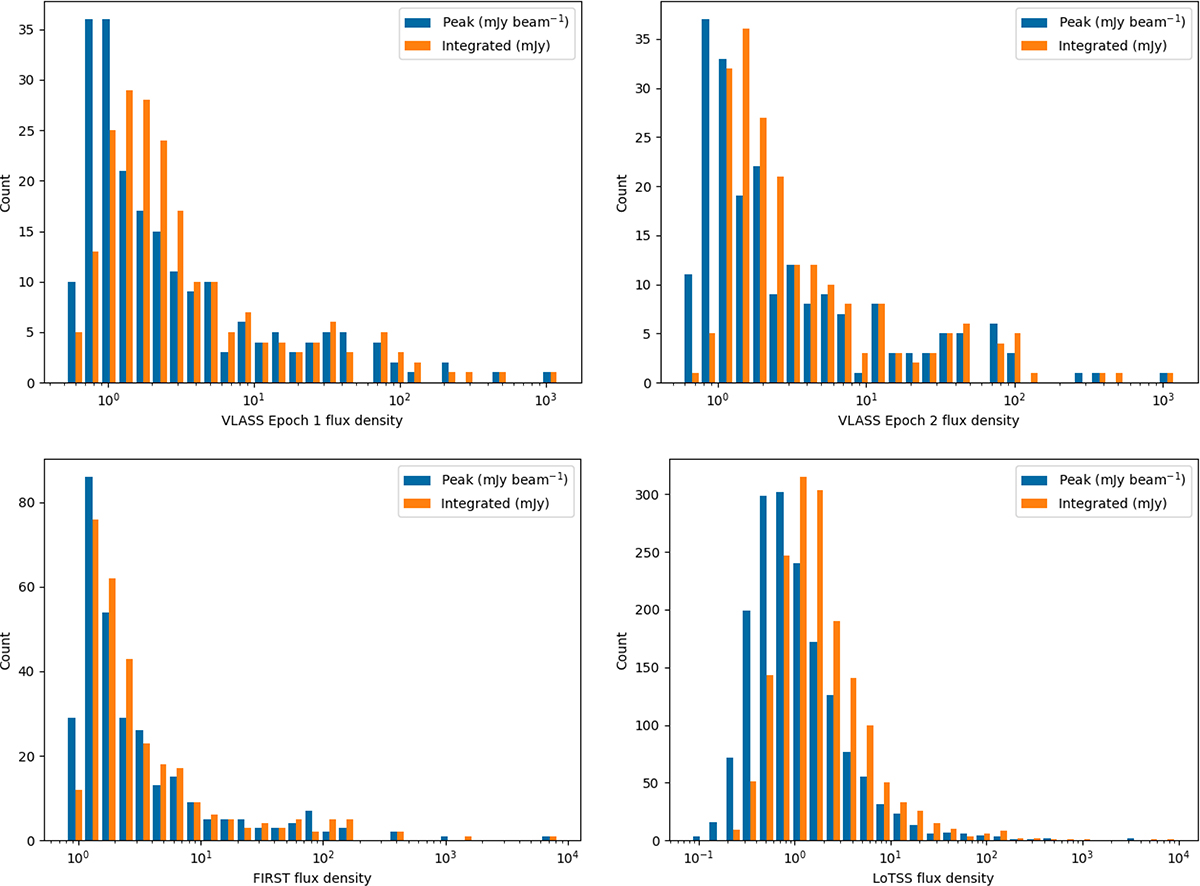
Download original image
Distribution of peak and integrated flux densities. The peak flux density (mJy beam−1) is in blue and the integrated flux density (mJy) is in orange. Top-left panel: VLASS Epoch 1. Top-right panel: VLASS Epoch 2. Bottom left panel: FIRST. Bottom right panel: LoTSS All.
Current usage metrics show cumulative count of Article Views (full-text article views including HTML views, PDF and ePub downloads, according to the available data) and Abstracts Views on Vision4Press platform.
Data correspond to usage on the plateform after 2015. The current usage metrics is available 48-96 hours after online publication and is updated daily on week days.
Initial download of the metrics may take a while.