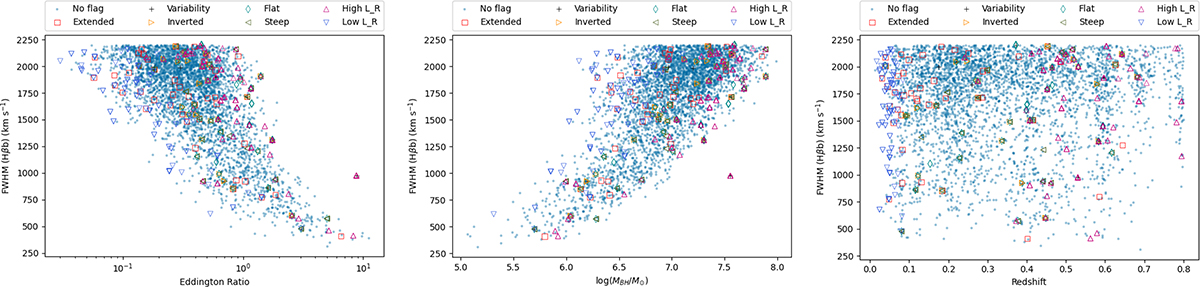
Fig. A.1.
Download original image
Extreme behavior of sources in FWHM(Hβ) plots. The blue, slightly opaque circles denote the sources with no extreme behavior. The red square symbols denote sources that are the most extended in our sample. The black plus symbols denote sources with extreme variability. The orange right-oriented triangles denote sources that have their highest spectral indices in the inverted region. The turquoise diamond symbols denote sources that have their highest spectral indices in the flat region. The dark green left-oriented triangles denote sources that have their lowest spectral indices in the steep region. The magenta right-side up triangles denote sources with the highest radio luminosities. The lilac upside-down triangles denote sources with the lowest radio luminosities. Spectral index extremes have been determined for 144 MHz - 1.4 GHz - 3 GHz (see Sect. 3.3). Left panel: Eddington ratio. Middle panel: Logarithmic black hole mass ratio compared with the solar mass. Right panel: Redshift.
Current usage metrics show cumulative count of Article Views (full-text article views including HTML views, PDF and ePub downloads, according to the available data) and Abstracts Views on Vision4Press platform.
Data correspond to usage on the plateform after 2015. The current usage metrics is available 48-96 hours after online publication and is updated daily on week days.
Initial download of the metrics may take a while.