Open Access
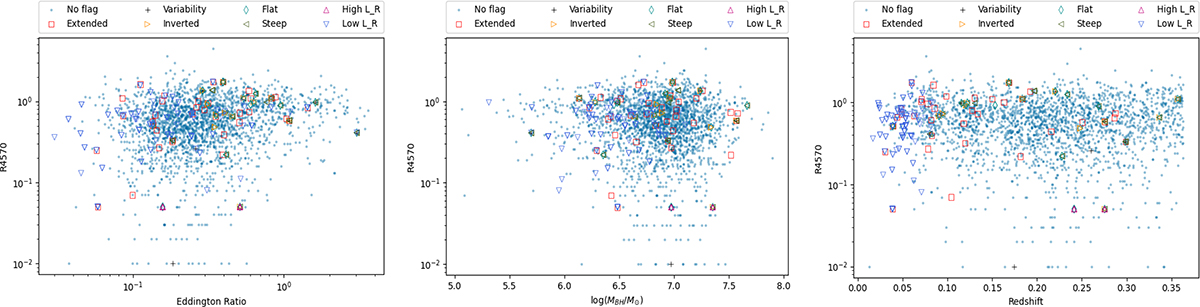
Fig. A.4.
Download original image
Extreme behavior of sources in R4570 plots. Colors, symbols, and spectral indices as in Fig.A.1. Left panel: Eddington ratio. Middle panel: Logarithmic black hole mass ratio compared with the solar mass. Right panel: Redshift.
Current usage metrics show cumulative count of Article Views (full-text article views including HTML views, PDF and ePub downloads, according to the available data) and Abstracts Views on Vision4Press platform.
Data correspond to usage on the plateform after 2015. The current usage metrics is available 48-96 hours after online publication and is updated daily on week days.
Initial download of the metrics may take a while.