Fig. 1
Download original image
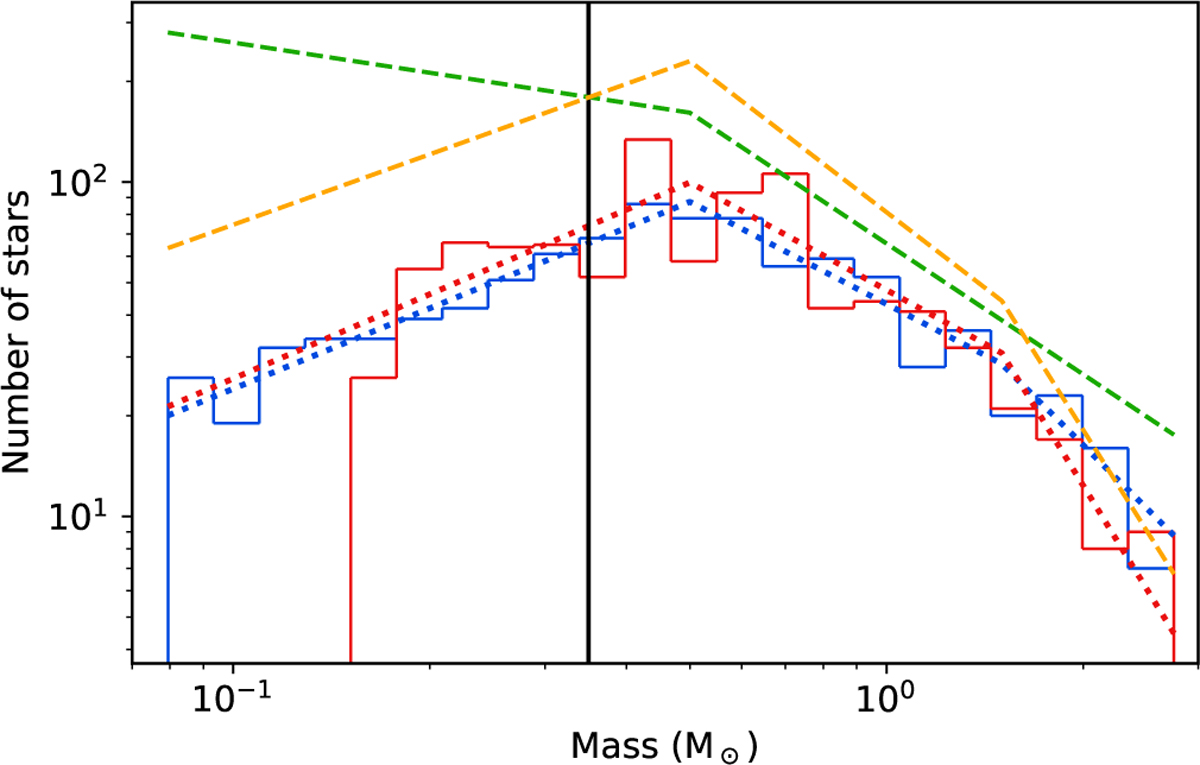
Mass functions of the BFSR (solid blue histogram) and the observed cluster (solid red histogram) together with a fitted three-part power law (dotted lines in blue and red). Further, the course of the Kroupa IMF (Kroupa 2001) (dashed green) and the used IMF for the BFSR (dashed orange) are shown with an arbitrary scaling for good visibility. The completeness limit is marked by the black line. We emphasise that unresolved binary systems in the real cluster have not been taken into account in the models. This can lead to a significant bias (Kroupa et al. 1991; Wirth et al. 2024).
Current usage metrics show cumulative count of Article Views (full-text article views including HTML views, PDF and ePub downloads, according to the available data) and Abstracts Views on Vision4Press platform.
Data correspond to usage on the plateform after 2015. The current usage metrics is available 48-96 hours after online publication and is updated daily on week days.
Initial download of the metrics may take a while.