Fig. 5
Download original image
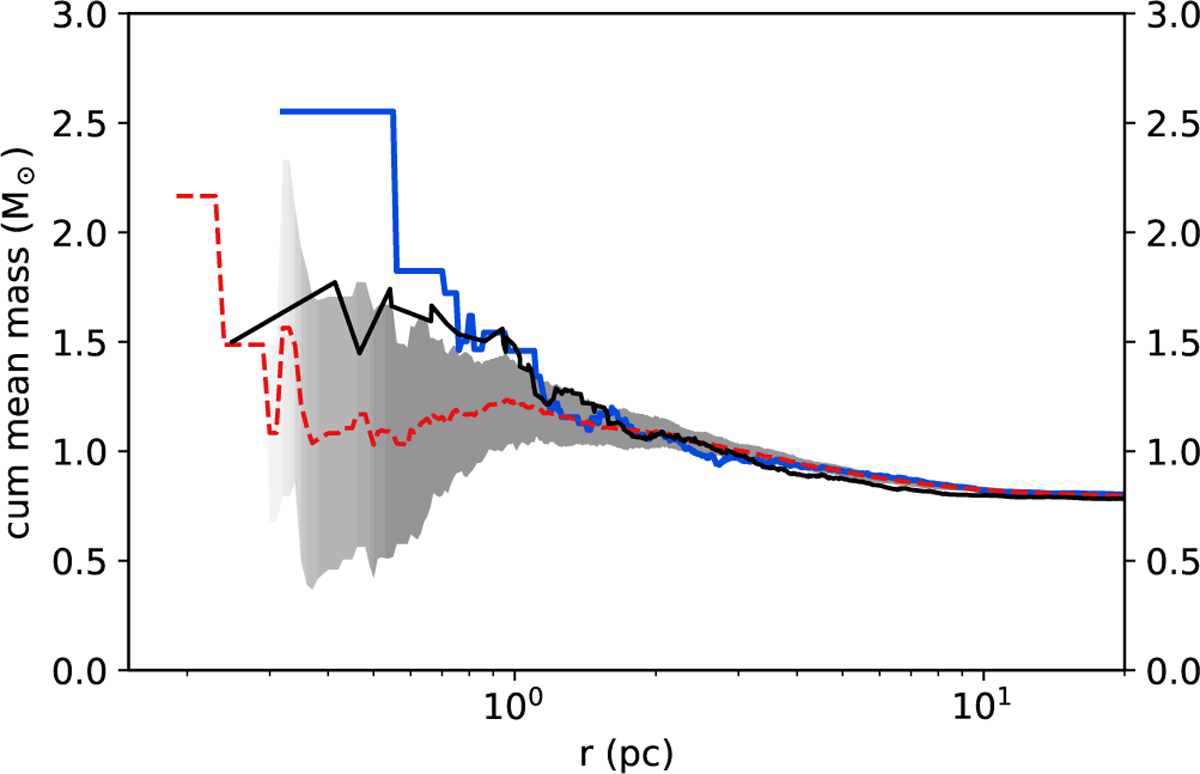
Mass segregation represented by the cumulative mean mass profile of stars above the completeness limit at 708 Myr: from the BFSR (solid blue), from the observation (solid black), the average of 15 different simulations with different random seeds for the coordinate and velocity distribution or IMF (dashed red), and their 1 σ range (grey area). The lighter shades of grey represent the lower number (only ~4–5) of simulations, which had stars inside that radius from the cluster centre.
Current usage metrics show cumulative count of Article Views (full-text article views including HTML views, PDF and ePub downloads, according to the available data) and Abstracts Views on Vision4Press platform.
Data correspond to usage on the plateform after 2015. The current usage metrics is available 48-96 hours after online publication and is updated daily on week days.
Initial download of the metrics may take a while.