Fig. 6
Download original image
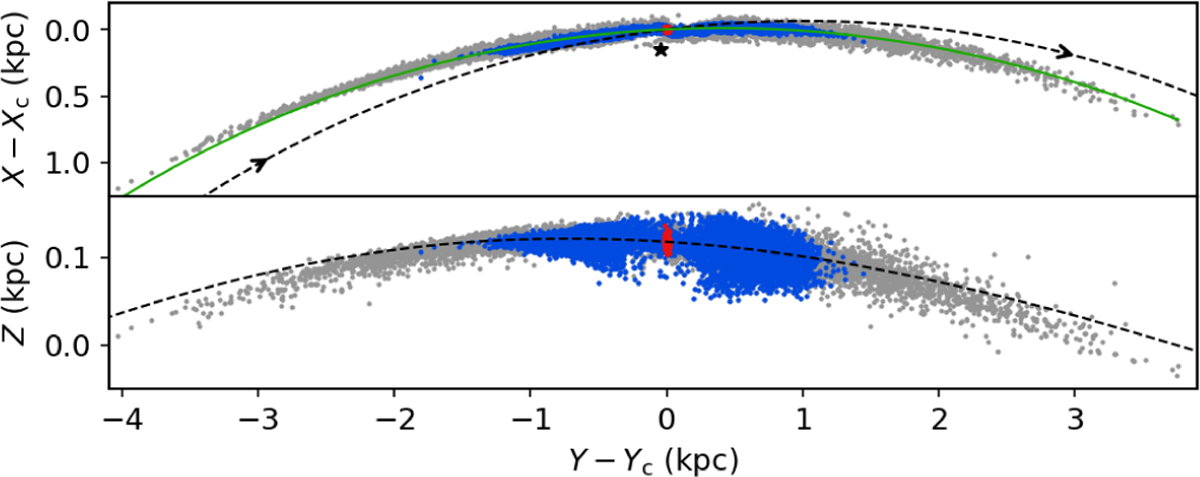
Structure of the tidal tails at 708 Myr. Blue dots show the stars that escaped the cluster after the violent relaxation phase ended. Grey dots mark all stars that were lost during the violent relaxation phase, lasting the first 20 Myr of the simulation. Red dots show the cluster stars and the dashed black line the orbit of the cluster centre with the direction of the orbit indicated. The fitted tail line is shown in green. The Sun is marked with a black star. Note the different scaling of the Z-axis. A similar type of tail structure (based on the idea of Tail I – ‘gas expulsion tail’ and Tail II – ‘stars evaporation tail’) is also described in Dinnbier & Kroupa (2020a).
Current usage metrics show cumulative count of Article Views (full-text article views including HTML views, PDF and ePub downloads, according to the available data) and Abstracts Views on Vision4Press platform.
Data correspond to usage on the plateform after 2015. The current usage metrics is available 48-96 hours after online publication and is updated daily on week days.
Initial download of the metrics may take a while.