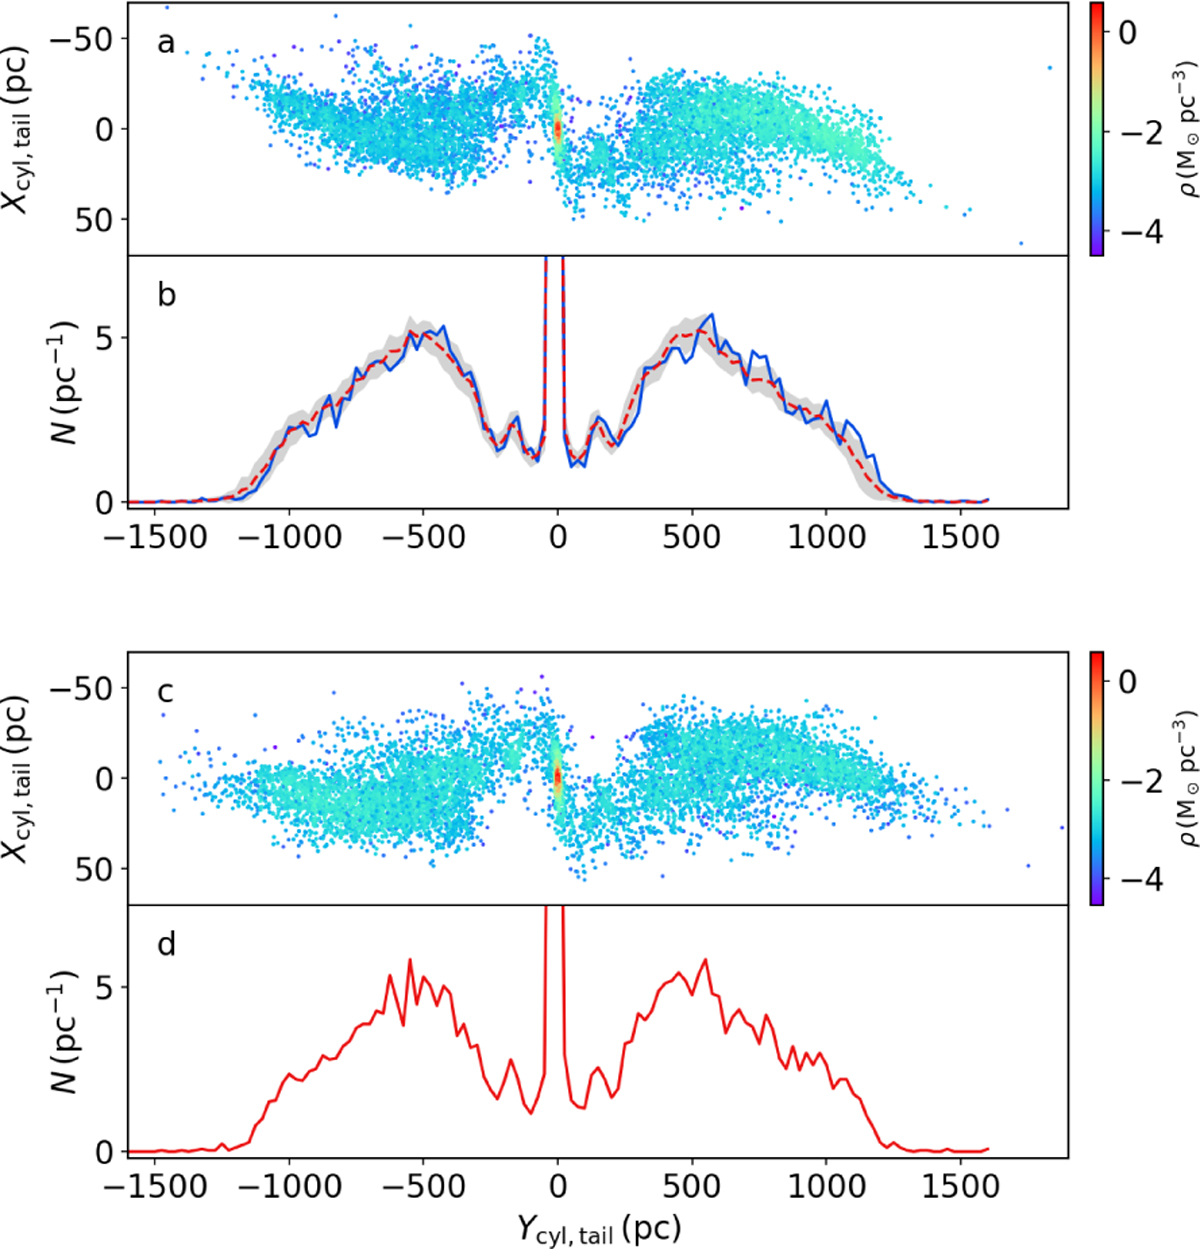
Fig. 7
Download original image
3D densities and 1D number densities of the tidal tails of the BFSR and the COSR at 708 Myr, with the x-axis being the tail line shown in Fig. 8 (top panel). Upper two panels: densities at 708 Myr of the BFSR. Lower two panels: densities of the COSR at 708 Myr. (a) Scatter plot of the tidal tails (blue dots in Fig. 6) with colour-coded logarithm of the 3D mass density. (b) 1D Number density of the BFSR (blue line). The dashed red line shows the mean of all 15 simulations. The grey area shows the 1 σ region. The panels (c) and (d) show the same as for the COSR. Note that in (d) only the 1D number density is shown, as only one run was done for comparison.
Current usage metrics show cumulative count of Article Views (full-text article views including HTML views, PDF and ePub downloads, according to the available data) and Abstracts Views on Vision4Press platform.
Data correspond to usage on the plateform after 2015. The current usage metrics is available 48-96 hours after online publication and is updated daily on week days.
Initial download of the metrics may take a while.