Fig. 8
Download original image
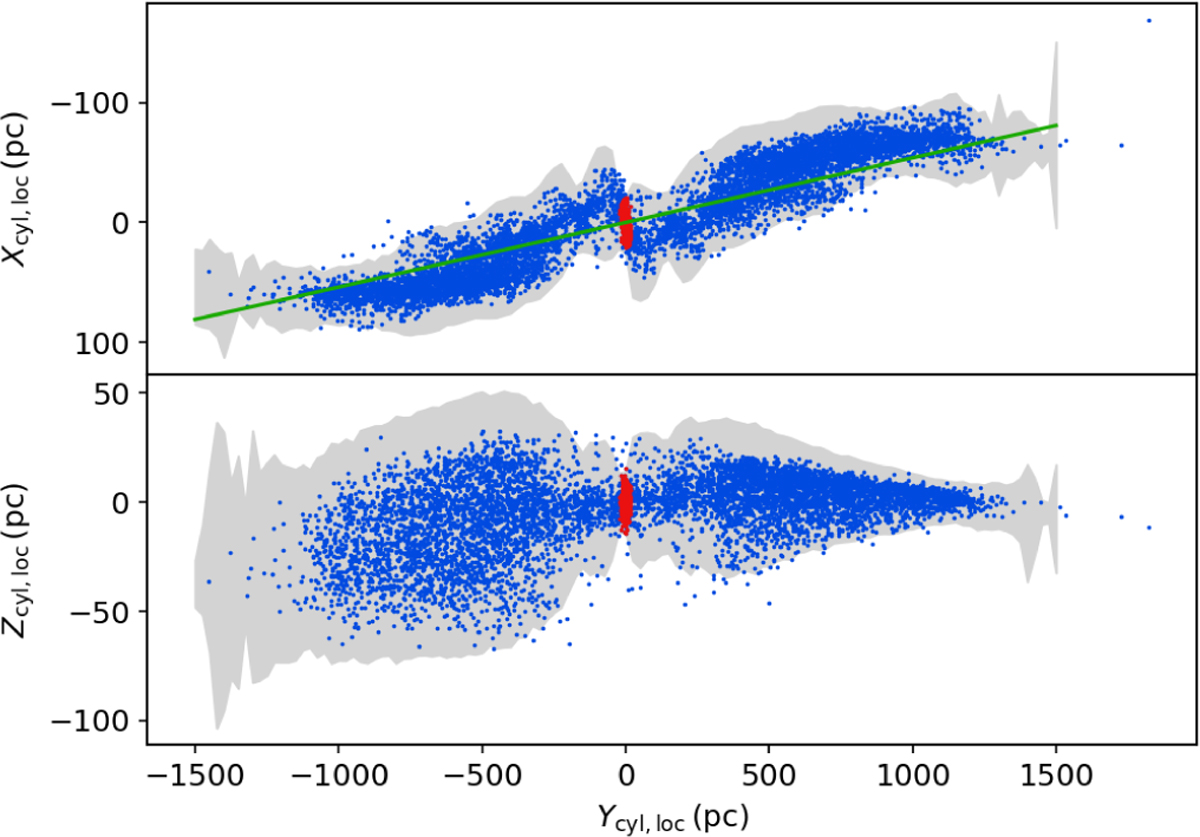
Average tail shapes at 708 Myr. Top panel: Xcyl,loc–Ycyl,loc-plane shape with the tail line in green. Bottom panel: Ycyl,loc–Zcyl,loc-plane shape via the grey area, denoting the 3 σ region of the stars to the mean per bin. The blue and red dots represent the BFSR tail stars and the cluster stars, respectively. Note the scaling of the ordinate axis in each of the panels.
Current usage metrics show cumulative count of Article Views (full-text article views including HTML views, PDF and ePub downloads, according to the available data) and Abstracts Views on Vision4Press platform.
Data correspond to usage on the plateform after 2015. The current usage metrics is available 48-96 hours after online publication and is updated daily on week days.
Initial download of the metrics may take a while.