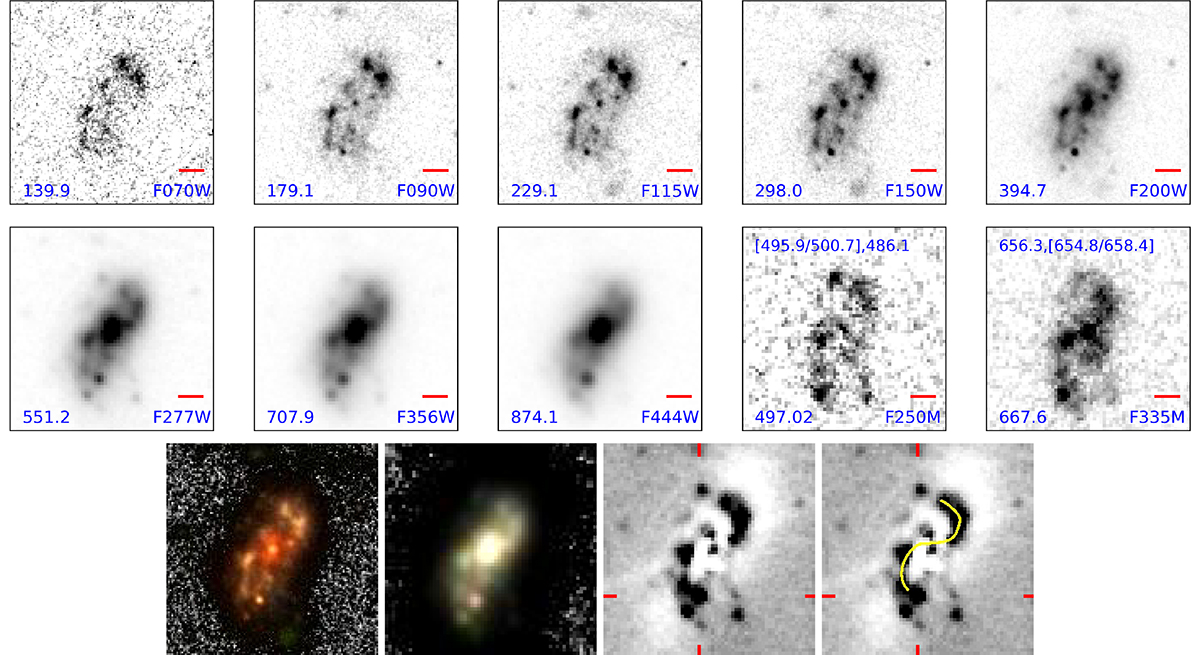
Fig. 1.
Download original image
Grayscale cutouts of Alaknanda in all JWST/NIRCam broadband filters (top two rows). The red horizontal bar in the bottom right corner of each cutout shows a 2 kpc scale at the redshift of the galaxy. We also provide the central rest-frame wavelength (in nm) for each filter in the bottom left of each cutout. The F250M and F335M filters contain the [OIII]+H-β and H-α+[NII] emission line complexes, respectively. In the last two panels of the middle row the continuum subtracted images in the F250M and F335M filters show the regions with line emission in the disk. In these two panels, we show the rest-frame wavelengths (in nm) of the [OIII] doublet and H-β in the F250M cutout and H-α and [NII] doublet in the F335M cutout at the top. The bottom row shows RGB composite images of the galaxy in sequence (from left to right): RGB composite with F200W, F150W, F090W SW filters, and RGB image with F444W, F356W, and F277W LW filters. The last two images in the bottom row show the GALFIT residual in F277W filter obtained after subtracting the bulge + disk model derived by GALFIT and the outline of the spiral arms of the galaxy (yellow curve) superposed on the GALFIT residual. The red ticks on the x- and y-axes point to the location of the possible satellite spheroid galaxy at z = 3.973671. All cutouts are 2.5 × 2.5 arcsec in size; north is on top and east is to the left.
Current usage metrics show cumulative count of Article Views (full-text article views including HTML views, PDF and ePub downloads, according to the available data) and Abstracts Views on Vision4Press platform.
Data correspond to usage on the plateform after 2015. The current usage metrics is available 48-96 hours after online publication and is updated daily on week days.
Initial download of the metrics may take a while.