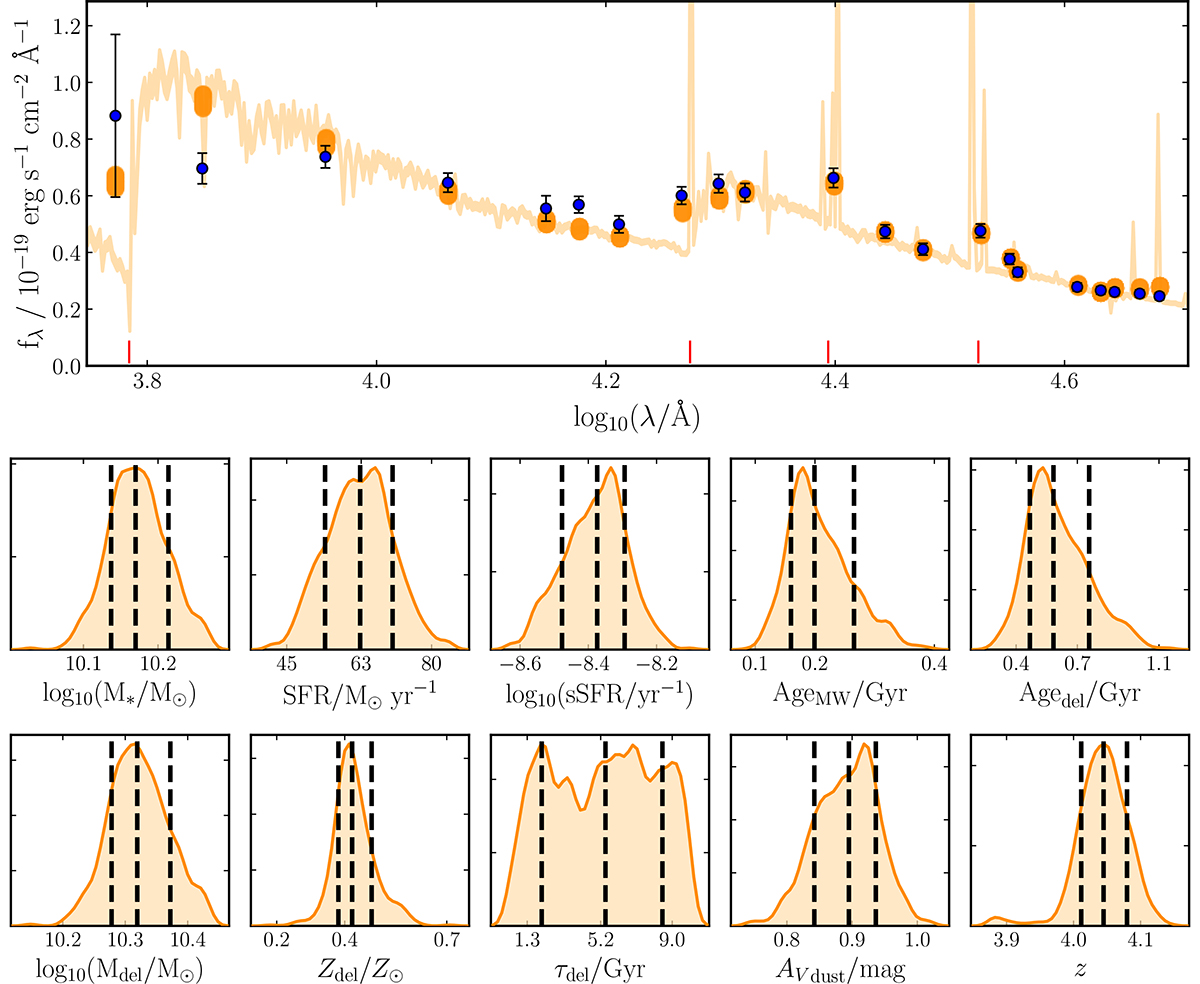
Fig. A.1.
Download original image
Top panel: Fitted model (orange curve), the model fluxes in each filter (orange points), and the observed photometry with error bars (blue points) for the delayed SFH model. Along the X-axis the red-tick marks indicate the positions, from left to right, of the Lyman break, the Balmer break, and the [OIII] + H-β and H-α + [NII] line complexes. Bottom panels: 1D posteriors of output SPS parameters such as stellar mass, SFR, sSFR, age, formed mass (Mdel), metallicity (log(Zdel/Z⊙)), τ, dust attenuation (Av), and redshift (labeled on the x-axis). The three black vertical dashed lines indicate the values of the 16th, 50th, and 84th percentiles of the output posterior probability distribution of each parameter. AgeMW is the mass-weighted age of the galaxy, and Agedel is the amount of time that has passed since the onset of star formation in the galaxy, calculated from the modeled delayed SFH.
Current usage metrics show cumulative count of Article Views (full-text article views including HTML views, PDF and ePub downloads, according to the available data) and Abstracts Views on Vision4Press platform.
Data correspond to usage on the plateform after 2015. The current usage metrics is available 48-96 hours after online publication and is updated daily on week days.
Initial download of the metrics may take a while.