Fig. C.3
Download original image
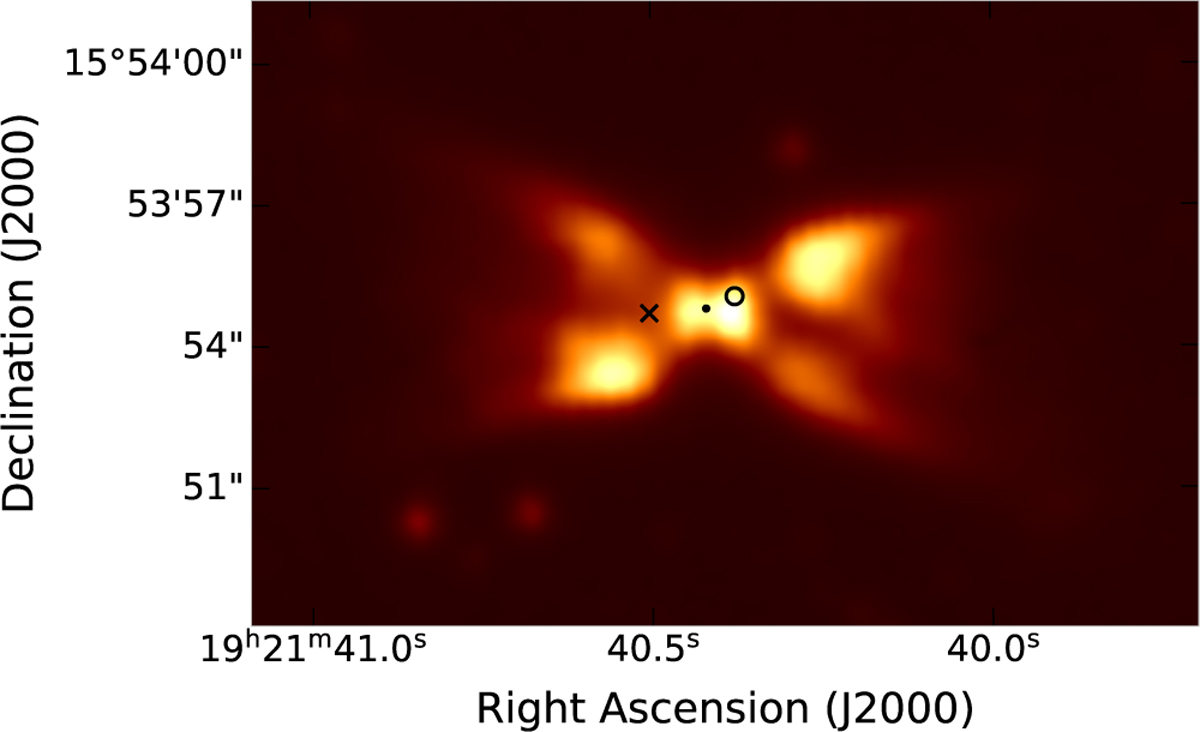
Near-infrared broadband emission at 2.1 μm of IRAS 19194+1548 by the UKIRT in logarithmic scale. The black empty circle and ‘x’ lie at the reported positions of the continuum emission peak at 1.5 GHz and 1612 MHz OH maser, respectively. The sizes are proportional to their relative positional accuracy. The black point lies at the position of the continuum emission peak at 24 GHz from our VLA observations. Its size is proportional to its positional uncertainty.
Current usage metrics show cumulative count of Article Views (full-text article views including HTML views, PDF and ePub downloads, according to the available data) and Abstracts Views on Vision4Press platform.
Data correspond to usage on the plateform after 2015. The current usage metrics is available 48-96 hours after online publication and is updated daily on week days.
Initial download of the metrics may take a while.