Fig. C.4
Download original image
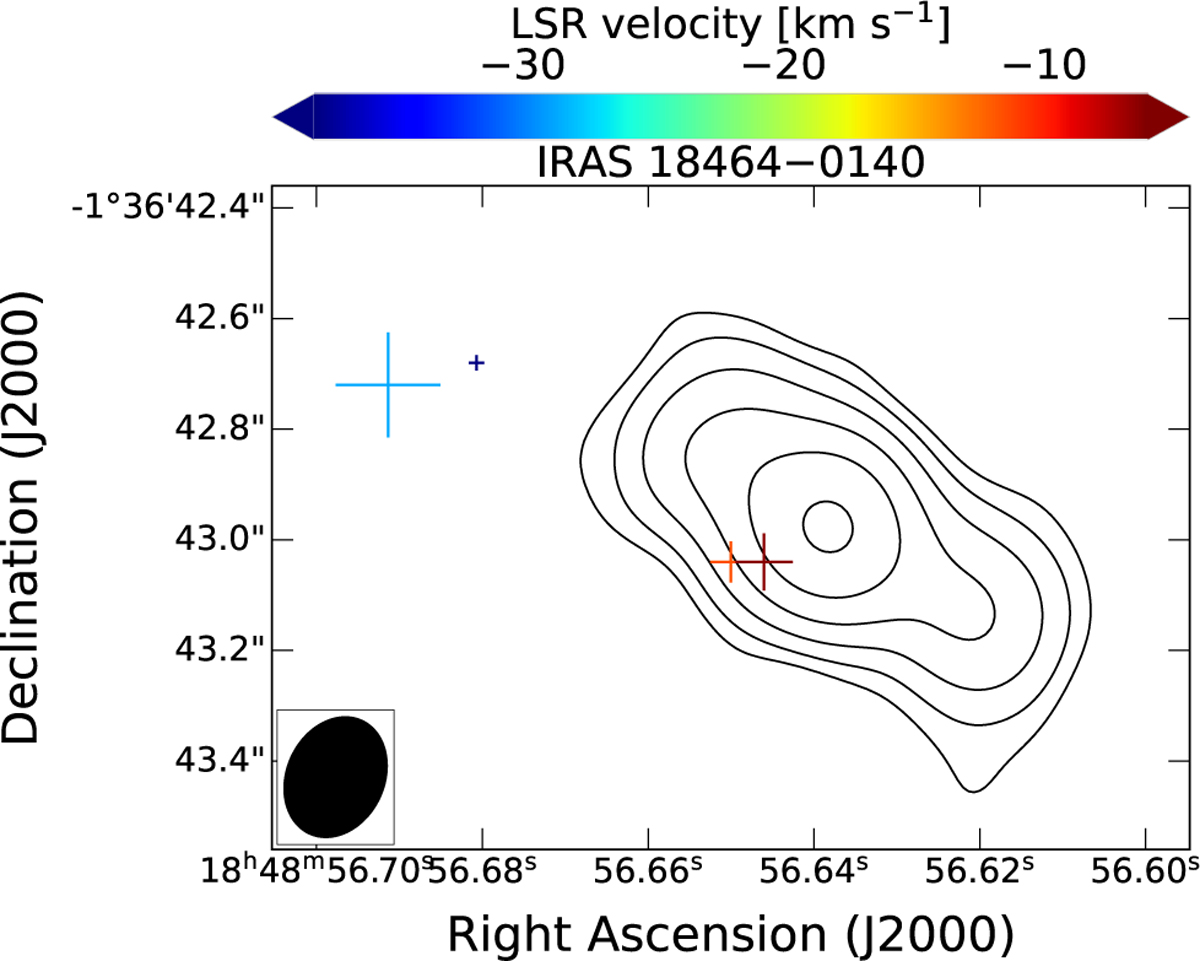
Contours of the radio continuum emission at 10 GHz of IRAS 18464–0140 from archival VLA data from observations performed on 2022. The contours increment in steps of 3σ×2n starting from n=0 (σ = 31 μJy beam−1). The crosses are the positions of the H2O masers obtained from our reprocessing of archival VLA data from observations performed on 1984. The color of the crosses represent the LSR velocity of the masers as indicated in the colorbar. The size of the crosses is proportional to the positional uncertainty of the masers.
Current usage metrics show cumulative count of Article Views (full-text article views including HTML views, PDF and ePub downloads, according to the available data) and Abstracts Views on Vision4Press platform.
Data correspond to usage on the plateform after 2015. The current usage metrics is available 48-96 hours after online publication and is updated daily on week days.
Initial download of the metrics may take a while.