Fig. 2
Download original image
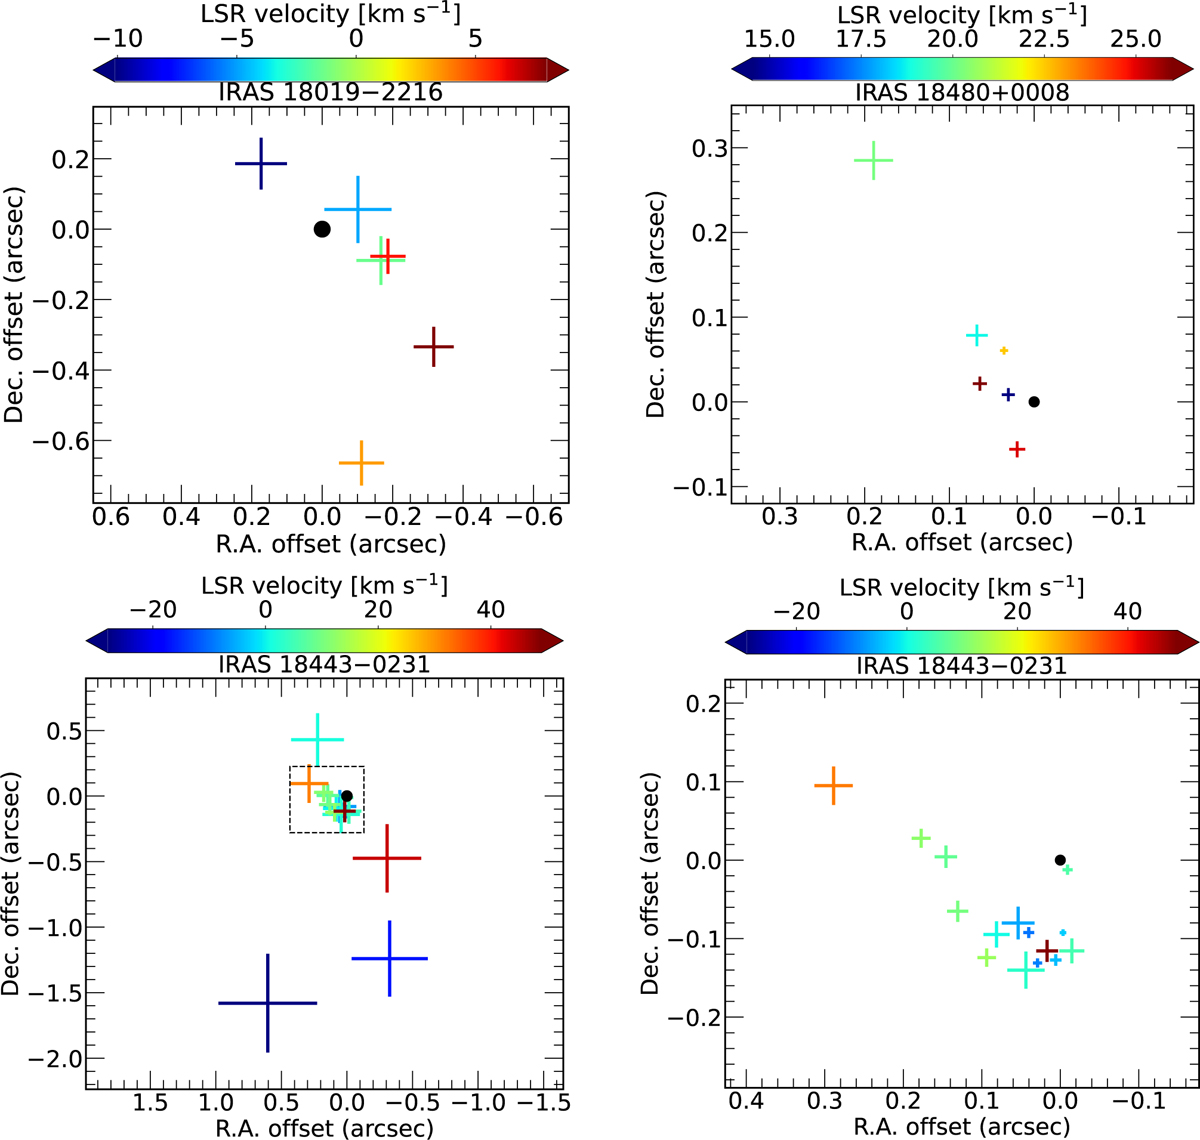
Spatial distribution of the H2O maser components (crosses) with respect to the position of the radio continuum emission peak (filled circle) at 22.22 GHz. The colorbar represent the LSR velocity of the masers and the symbols sizes are their positional uncertainties. The bottom right panel is a close-up of H2O maser components in the central area of IRAS 18443–0231 (marked by a black dashed rectangle in the left panel), close to the continuum emission peak.
Current usage metrics show cumulative count of Article Views (full-text article views including HTML views, PDF and ePub downloads, according to the available data) and Abstracts Views on Vision4Press platform.
Data correspond to usage on the plateform after 2015. The current usage metrics is available 48-96 hours after online publication and is updated daily on week days.
Initial download of the metrics may take a while.