Fig. 4
Download original image
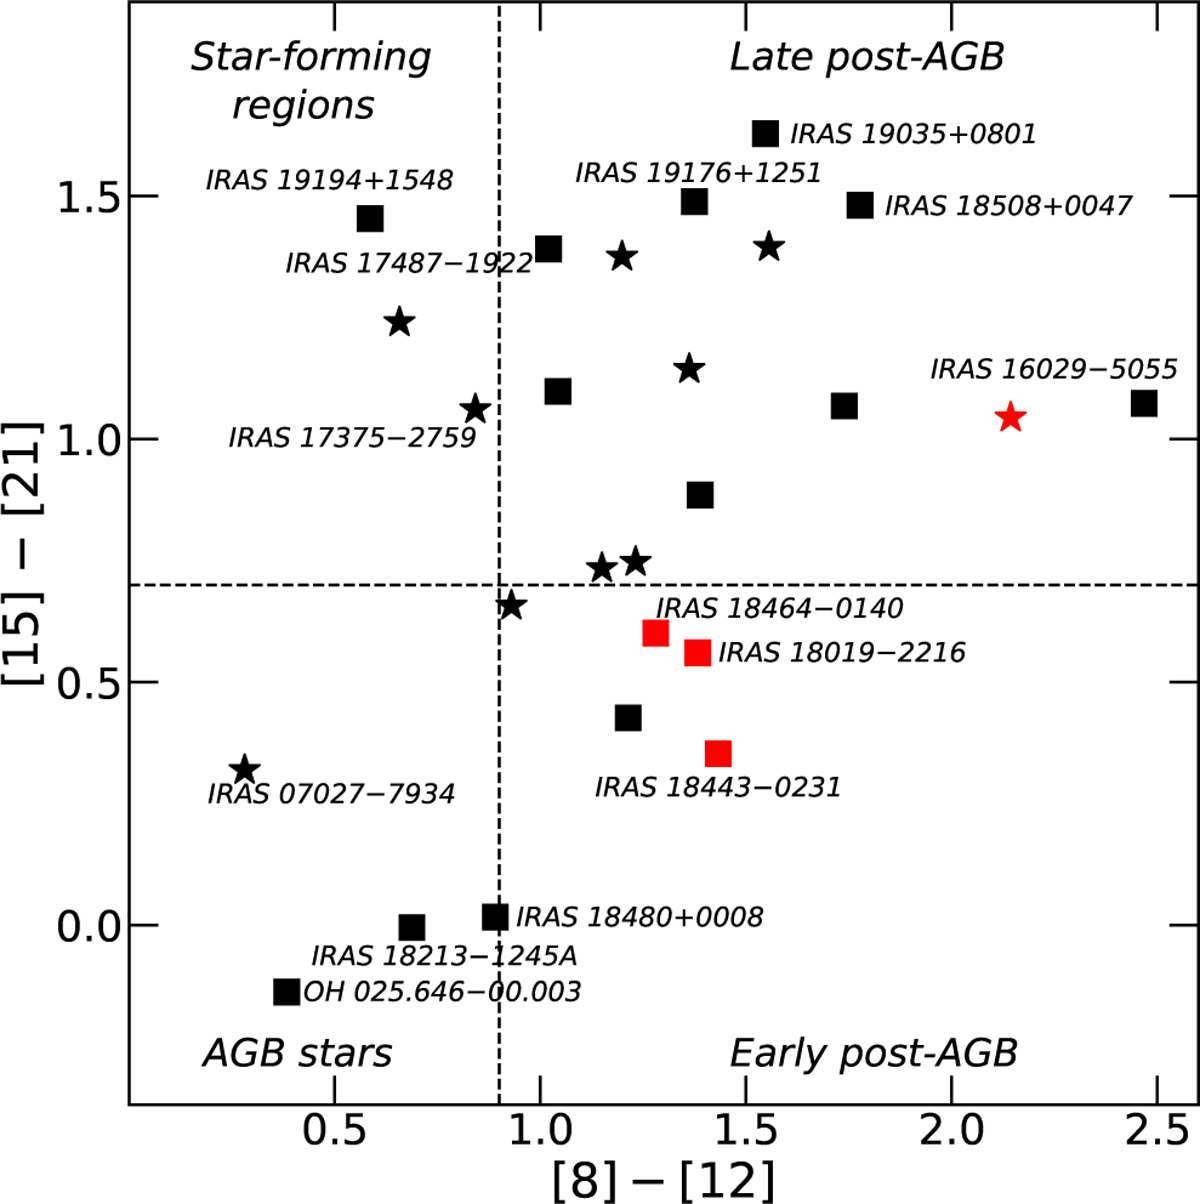
MSX color-color diagram, as defined by Sevenster (2002), including all known and new maser-emitting PNe and candidates, and adopted from Cala et al. (2022). The vertical and horizontal dashed lines separate the diagram into four quadrants, where different types of sources tend to cluster. The filled star and square symbols without source names represent the previously reported maser-emitting PNe and candidates, respectively. These same symbols with source names are the new maser-emitting PNe and candidates, respectively. IRAS 16029–5055, IRAS 17375–2759 and IRAS 19176+1251 are included as PNe (see Section 5.4). Symbols with red color represent sources with WF characteristics.
Current usage metrics show cumulative count of Article Views (full-text article views including HTML views, PDF and ePub downloads, according to the available data) and Abstracts Views on Vision4Press platform.
Data correspond to usage on the plateform after 2015. The current usage metrics is available 48-96 hours after online publication and is updated daily on week days.
Initial download of the metrics may take a while.