Fig. 7
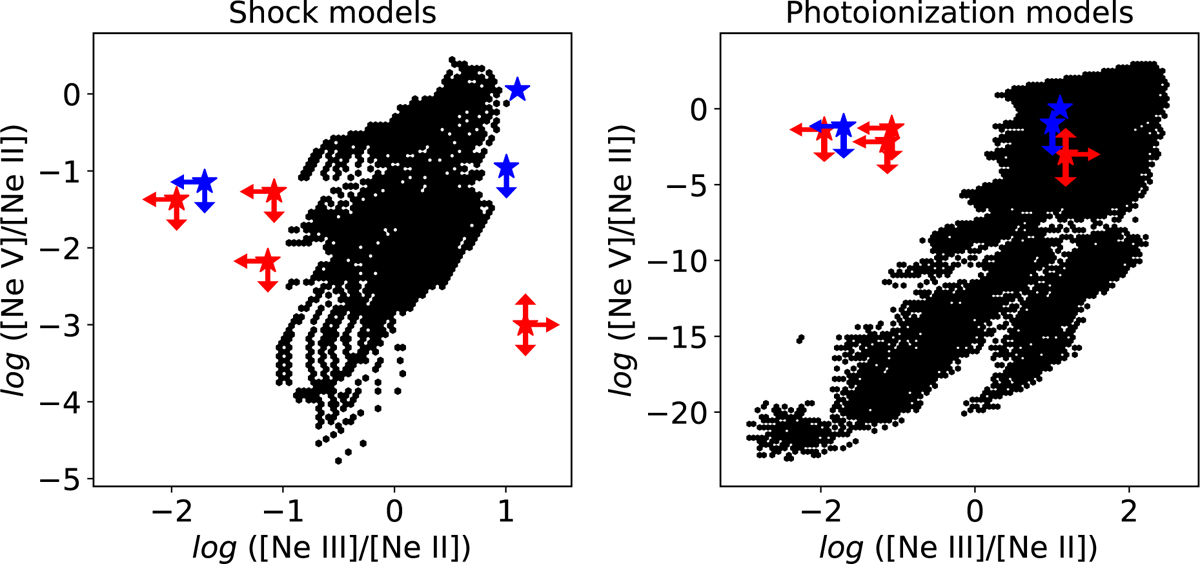
Download original image
Line ratio diagnostic diagram for the mid-infrared emission lines of [Ne II], [Ne III ], and [Ne V ] at 12.81, 15.55, and 14.32 μm, respectively. The left panel shows shock models, and the right panel shows photoionization models. The blue stars mark the new objects in which the presence of photoionized gas is favored by these diagrams (IRAS 16029–5055, IRAS 17375–2759, and IRAS 19176+1251). The red stars mark previously reported maser-emitting PNe (IRAS 17347–3139, IRAS 17393–2727, and K 3-35). The sizes of the symbols are larger than their errors. The arrows indicate values of line ratios that are either upper or lower limits, derived from the upper limits for the lines not detected in each case (see Fig. 6). In one case (K 3-35, red star with three arrows) the value log([Ne V]/[Ne II]) is undetermined, and it could be located anywhere in the vertical direction. See Appendix D for more details on the grid parameters.
Current usage metrics show cumulative count of Article Views (full-text article views including HTML views, PDF and ePub downloads, according to the available data) and Abstracts Views on Vision4Press platform.
Data correspond to usage on the plateform after 2015. The current usage metrics is available 48-96 hours after online publication and is updated daily on week days.
Initial download of the metrics may take a while.