Fig. C.1
Download original image
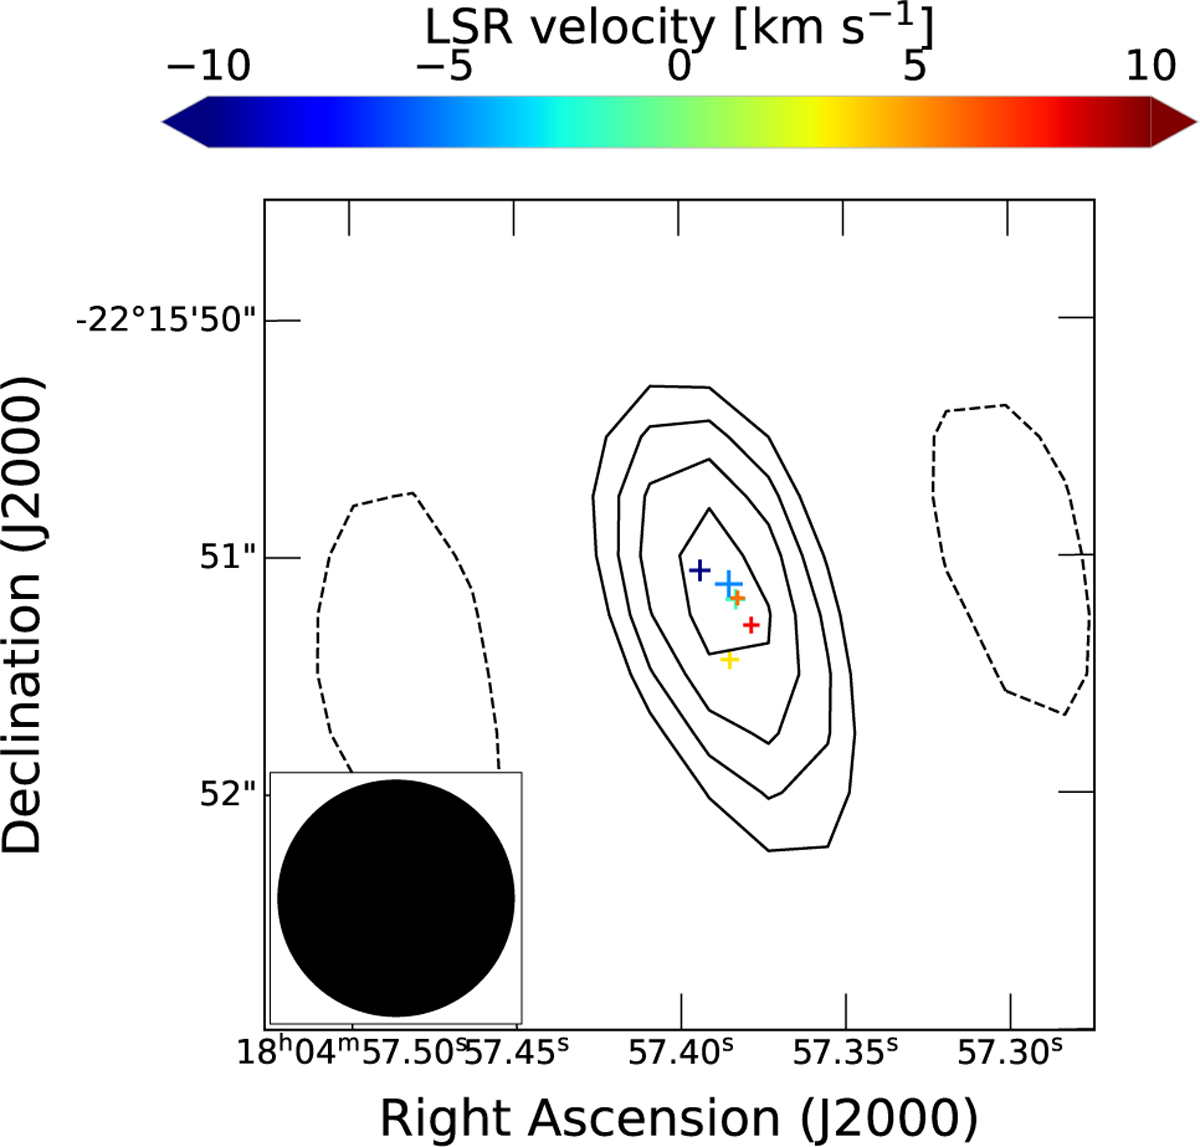
Radio continuum emission at 5.7 GHz of IRAS 18019–2216 from GLOSTAR. The contours are −3, 3, 4, 5, and 6 × 1σ (where σ = 90 μJy beam−1 is the rms of the map). The crosses are the positions of the H2O masers, as shown in Fig. 2 (top left panel), assuming that the peak emission of the radio continuum emission at 22.22 GHz from our VLA observations lies at the same position as that of this map at 5.7 GHz. The color of the crosses represent the LSR velocity of the masers as indicated in the colorbar. The size of the crosses is proportional to the positional uncertainty of the masers. The beam is shown at the bottom left corner.
Current usage metrics show cumulative count of Article Views (full-text article views including HTML views, PDF and ePub downloads, according to the available data) and Abstracts Views on Vision4Press platform.
Data correspond to usage on the plateform after 2015. The current usage metrics is available 48-96 hours after online publication and is updated daily on week days.
Initial download of the metrics may take a while.