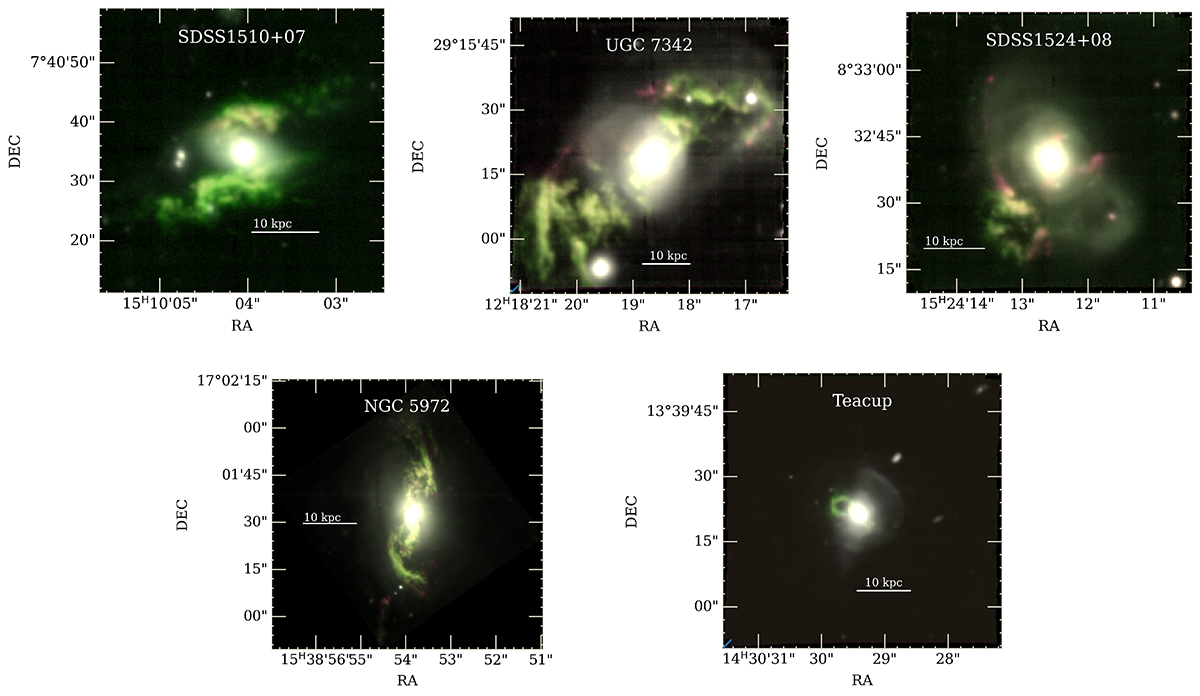
Fig. 1.
Download original image
Composite color images for targets analyzed in this work with red, white, and green pseudo-colors. Images were created using three bands extracted from the data cube. Green was created with a spectral window that encloses the [OIII]5007 emission lines to represent the highly ionized gas; red was created with a spectral window that encloses Hα 6563 Å, while white represents the stellar continuum, with a spectral window of 7000–9000 Å. In all images, north is up and east is left.
Current usage metrics show cumulative count of Article Views (full-text article views including HTML views, PDF and ePub downloads, according to the available data) and Abstracts Views on Vision4Press platform.
Data correspond to usage on the plateform after 2015. The current usage metrics is available 48-96 hours after online publication and is updated daily on week days.
Initial download of the metrics may take a while.