Fig. 10.
Download original image
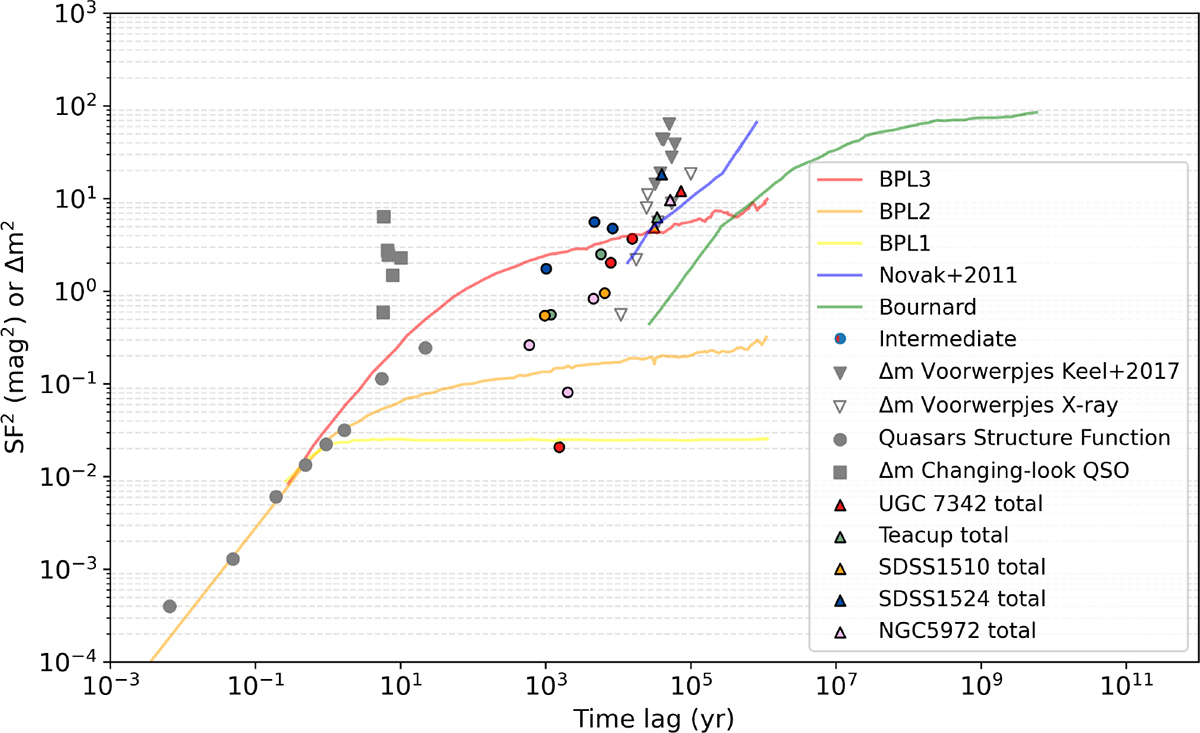
SF for magnitude difference at every measured radius (colored circles as described in the legend) and the total magnitude difference (colored triangles). We add in gray the variability data summarized in Fig. 2 of Sartori et al. (2018) for comparison. Gray circles represent the quasars’ structure function. Squares represent the δm for changing-look quasars. Downward triangles show the data for Voorwerpjes from Keel et al. (2017, filled triangles), and from X-ray data (empty triangles). The solid lines represent the BPL1, BPL2, and BPL3 models in yellow, orange, and red, respectively. The green and blue solid lines indicate SF from hydrodynamic simulations from Novak et al. (2011) and Bournaud (adapted from Sartori et al. 2018), respectively (see Sartori et al. 2018 for more details).
Current usage metrics show cumulative count of Article Views (full-text article views including HTML views, PDF and ePub downloads, according to the available data) and Abstracts Views on Vision4Press platform.
Data correspond to usage on the plateform after 2015. The current usage metrics is available 48-96 hours after online publication and is updated daily on week days.
Initial download of the metrics may take a while.