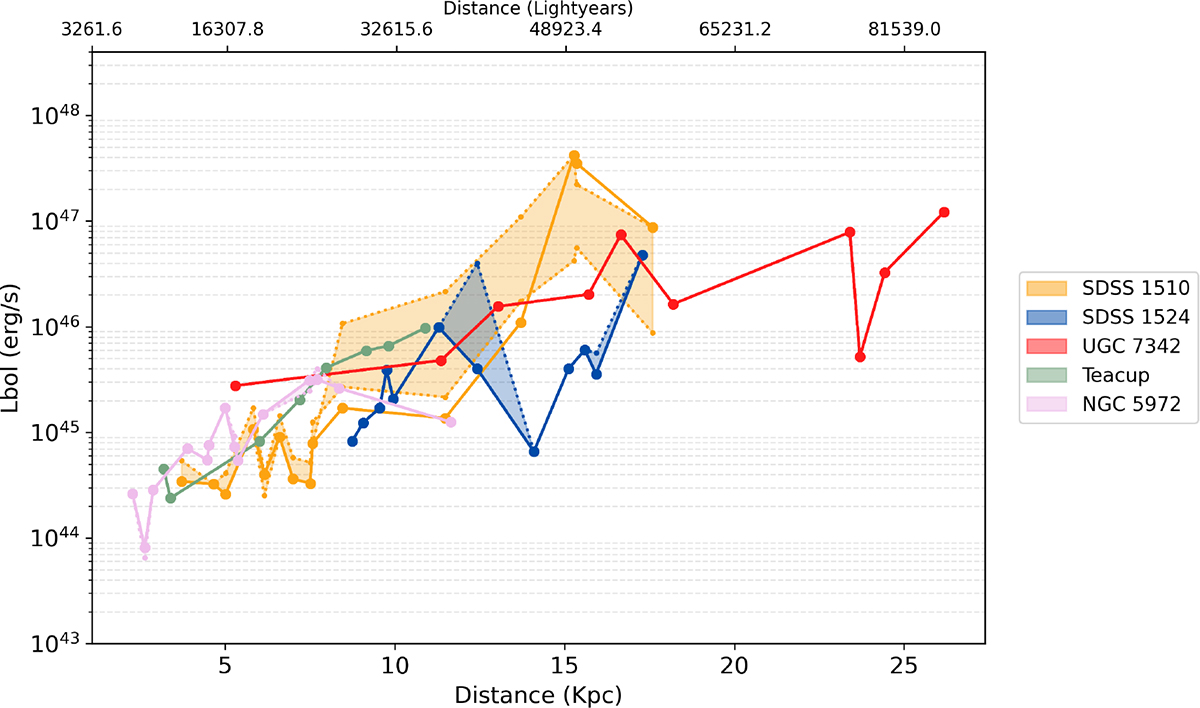
Fig. B.3.
Download original image
Derived bolometric luminosity as a function of the projected distance from the galaxy nucleus, as described in Fig. 9. The model outlined in Sect. 3.5 was run with different values of alpha in the range 13.6–500 eV. This change in the shape of the continuum correspond to the dispersion of values in the He II/Hβ ratio, showing as a solid line the median value, and in dotted lines (shaded in between) the ±1σ difference. For most of the galaxies in the sample, the change in the shape of the continuum translates into a small difference in the luminosity curve. SDSS 1510, which despite showing a larger spread in Lbol, maintains the trend of increasing luminosity with projected distance.
Current usage metrics show cumulative count of Article Views (full-text article views including HTML views, PDF and ePub downloads, according to the available data) and Abstracts Views on Vision4Press platform.
Data correspond to usage on the plateform after 2015. The current usage metrics is available 48-96 hours after online publication and is updated daily on week days.
Initial download of the metrics may take a while.