Fig. 4.
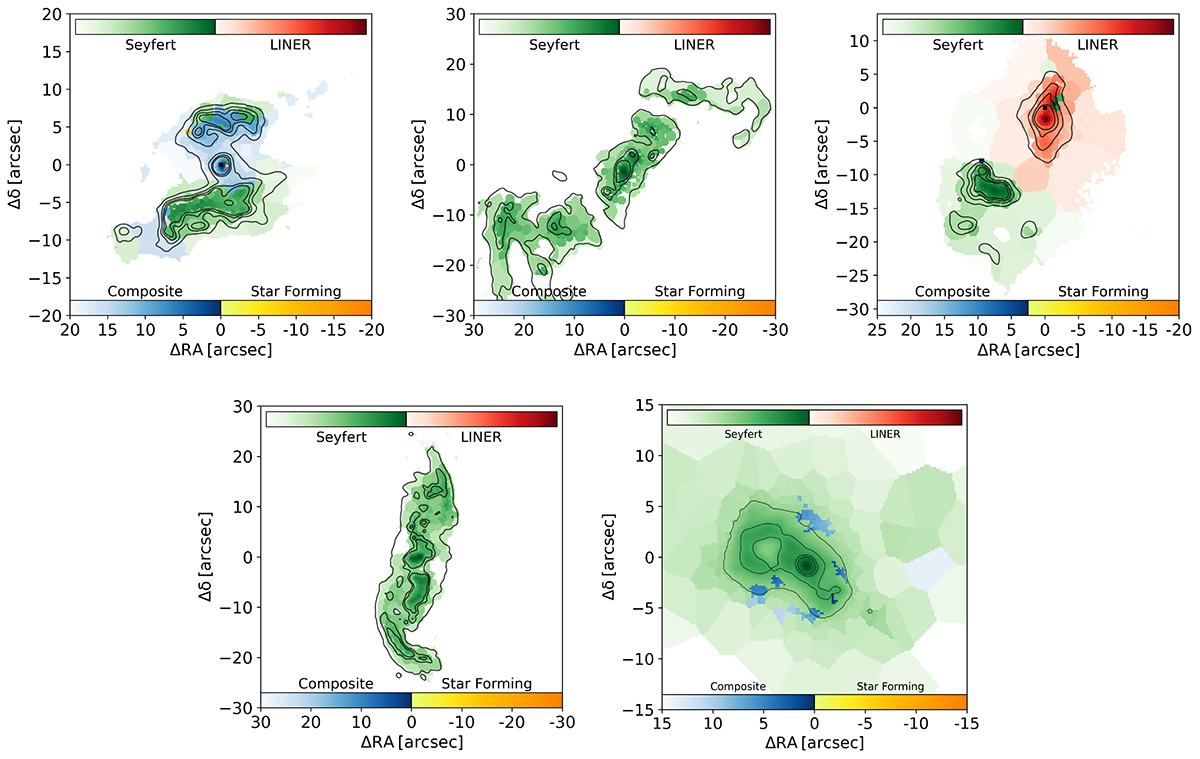
Download original image
Spatially resolved BPT classification maps based on [OIII]/Hβ versus [NII]/Hα BPT diagrams for SDSS1510+07, UGC 7342, SDSS1524+08 (top from left to right), NGC 5972, and the Teacup (bottom from left to right). The color bars indicate the different BPT regions, where green indicates the spaxels fall in the Seyfert section of the diagram, red for LINER, blue for composite, and yellow for star forming. Every color is weighted with the [OIII] emission-line flux to more clearly show the bright photoionized regions.
Current usage metrics show cumulative count of Article Views (full-text article views including HTML views, PDF and ePub downloads, according to the available data) and Abstracts Views on Vision4Press platform.
Data correspond to usage on the plateform after 2015. The current usage metrics is available 48-96 hours after online publication and is updated daily on week days.
Initial download of the metrics may take a while.