Open Access
Fig. 8.
Download original image
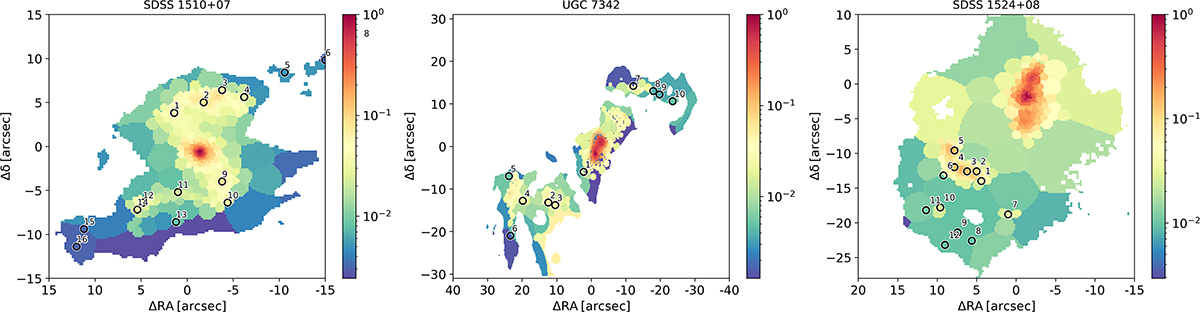
Apertures used for luminosity history analysis marked as black circles over [SII] emission line normalized flux maps. Left to right: SDSS1510+07, UGC 7342, and SDSS1524+08.
Current usage metrics show cumulative count of Article Views (full-text article views including HTML views, PDF and ePub downloads, according to the available data) and Abstracts Views on Vision4Press platform.
Data correspond to usage on the plateform after 2015. The current usage metrics is available 48-96 hours after online publication and is updated daily on week days.
Initial download of the metrics may take a while.