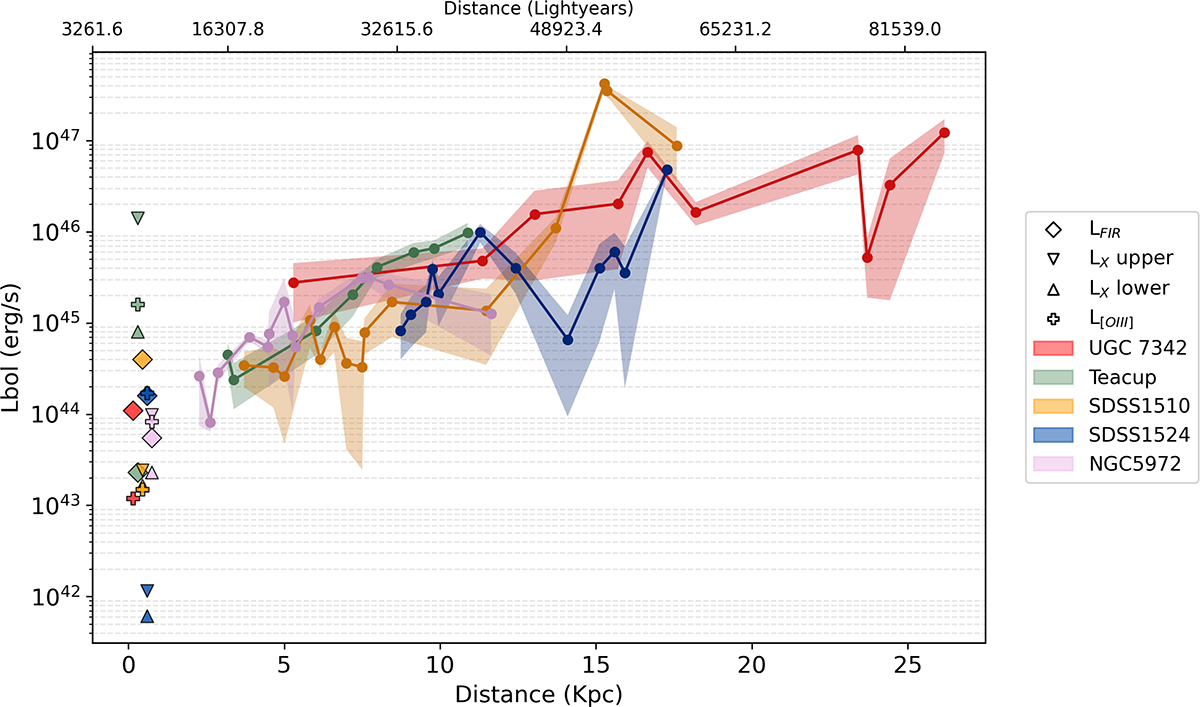
Fig. 9.
Download original image
Derived bolometric luminosity as function of projected distance from the galaxy center. Color circles correspond to the derived luminosity for each aperture along a source, using different colors for each system, as presented in the figure. The different estimates of current LBol are marked in the corresponding color for every galaxy; a small offset from the nucleus is added to improve the clarity of the different symbols. Shaded areas of corresponding colors represent the error for each luminosity value derived from MC simulations, as described in the text. There is a clear trend of increasing luminosity with increasing projected distance. This implies a significant change between ∼1–3 dex over ∼104 yr timescales.
Current usage metrics show cumulative count of Article Views (full-text article views including HTML views, PDF and ePub downloads, according to the available data) and Abstracts Views on Vision4Press platform.
Data correspond to usage on the plateform after 2015. The current usage metrics is available 48-96 hours after online publication and is updated daily on week days.
Initial download of the metrics may take a while.