Fig. 2
Download original image
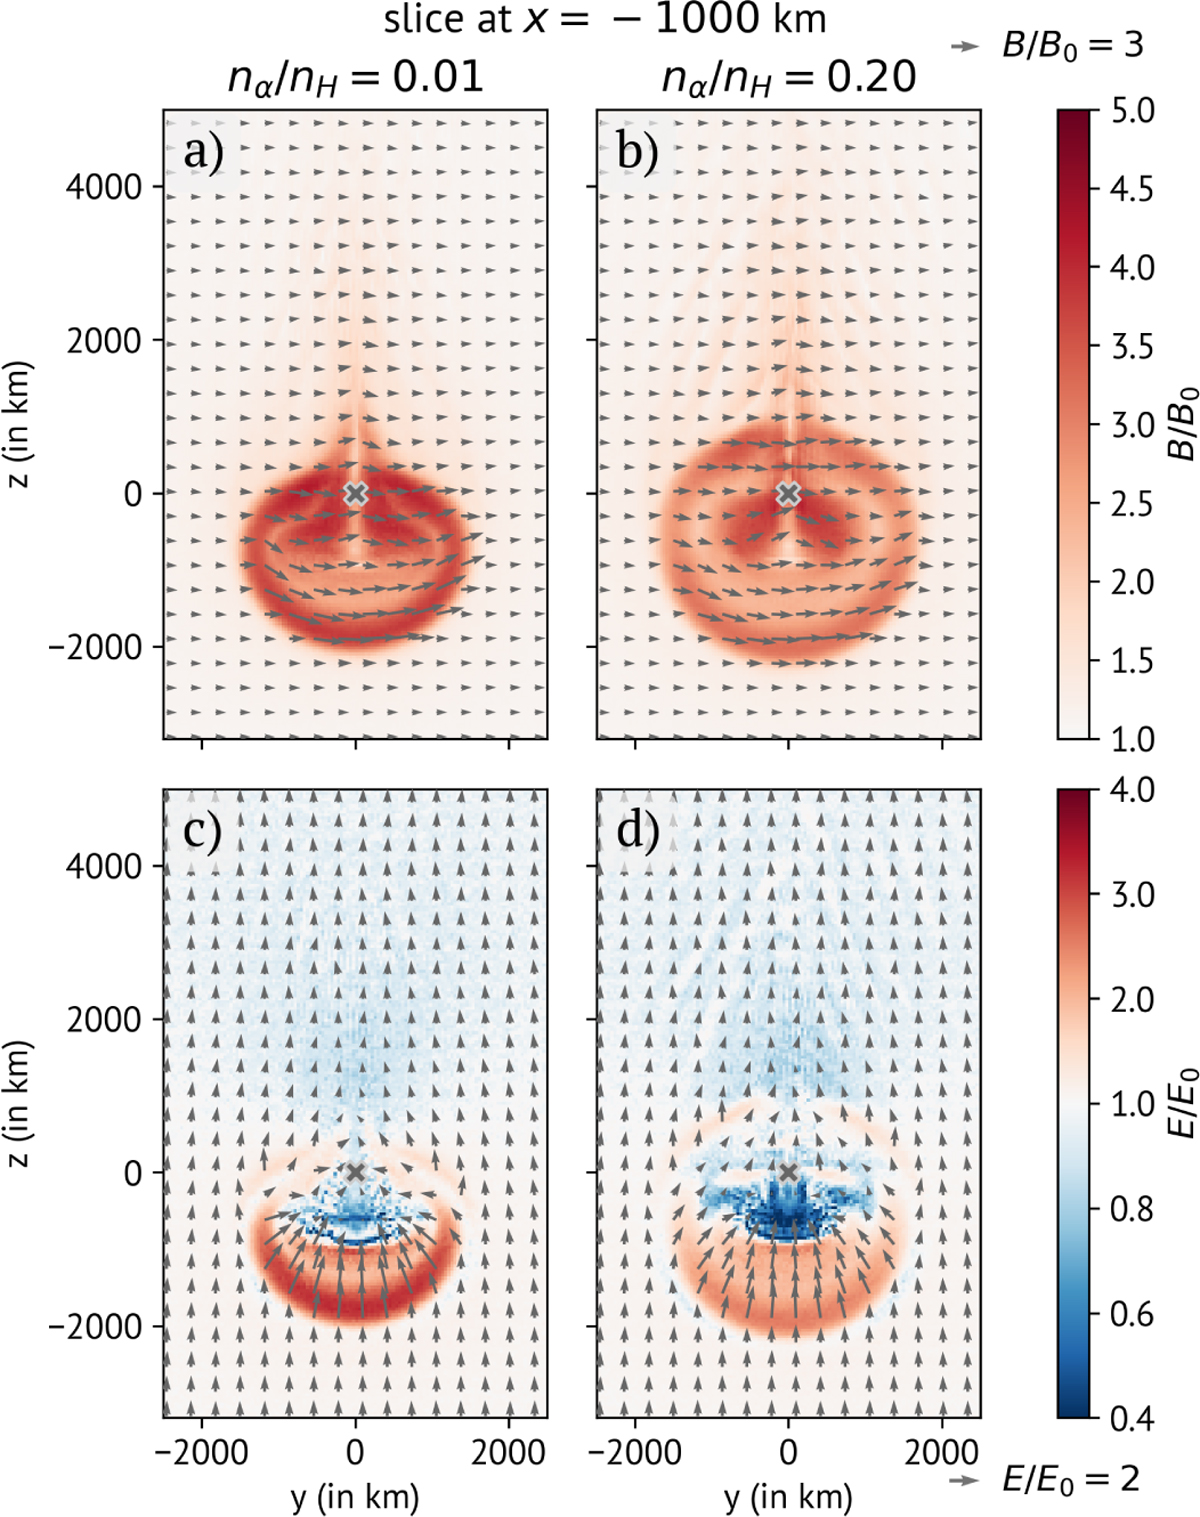
Magnetic (upper row, panels a and b) and electric (lower row, panels c and d) fields in the y - z plane, for the slice at x = −1000 km. The left side (panels a and c) shows the results of the low-alpha simulation. The right side (panels b and d) shows the results of the high-alpha simulation run. The background shows the magnitude of the electric and magnetic fields, normalised by their upstream values B0 = 3 nT and E0 = 1.29 mV/m. The arrows show the direction of the fields in this plane, that is, the y and z components. The arrow length scales are specified above and below the colour bars for the respective fields.
Current usage metrics show cumulative count of Article Views (full-text article views including HTML views, PDF and ePub downloads, according to the available data) and Abstracts Views on Vision4Press platform.
Data correspond to usage on the plateform after 2015. The current usage metrics is available 48-96 hours after online publication and is updated daily on week days.
Initial download of the metrics may take a while.