Fig. 3
Download original image
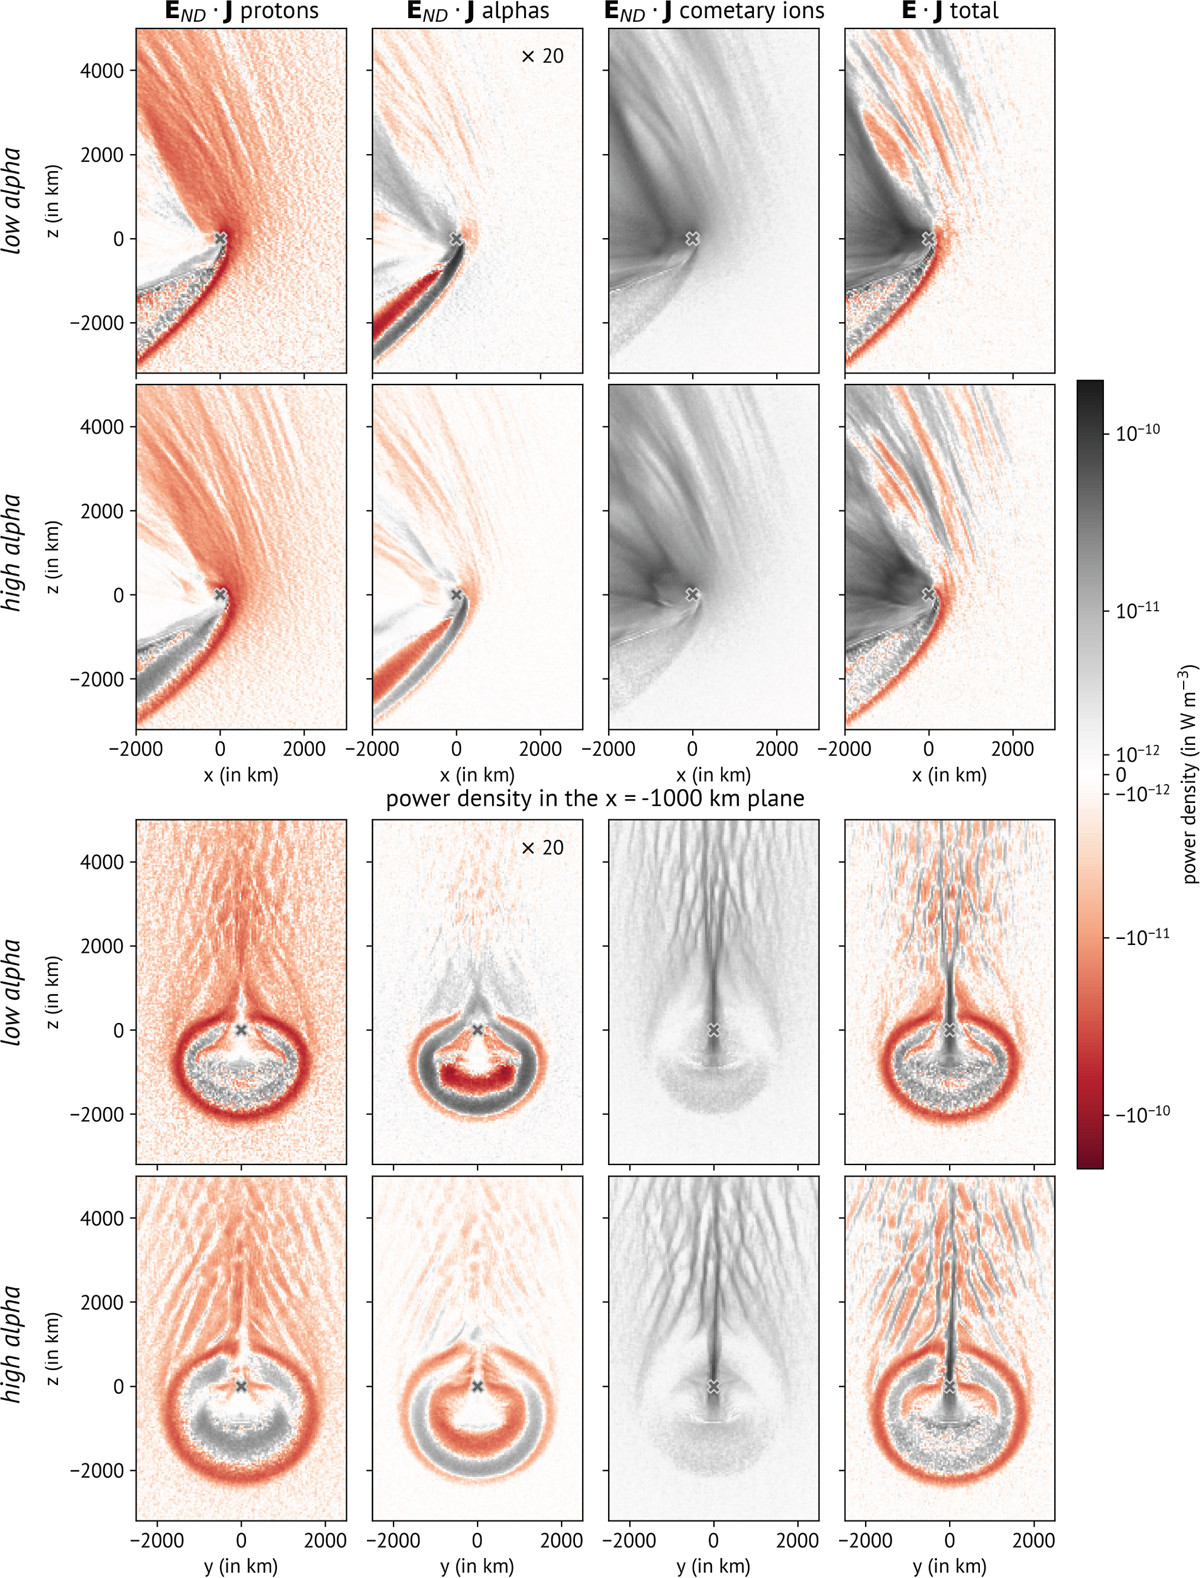
Power density, E ∙ J, for the low-alpha (rows 1 & 3) and the high-alpha (rows 2 & 4) cases. The upper two rows show the x - z plane at y = 0 km (same as Figure 1), while the lower two rows show the y - z plane at x = −1000 km (same as Figure 2). Columns 1-3 show the power density of protons, alpha particles, and cometary ions, respectively. The last column shows the total power density E ∙ J. For better visibility, the results of the power density of alphas in the low-alpha case (Column 2, rows 1 and 3) are scaled up by a factor of 20.
Current usage metrics show cumulative count of Article Views (full-text article views including HTML views, PDF and ePub downloads, according to the available data) and Abstracts Views on Vision4Press platform.
Data correspond to usage on the plateform after 2015. The current usage metrics is available 48-96 hours after online publication and is updated daily on week days.
Initial download of the metrics may take a while.