Fig. 4
Download original image
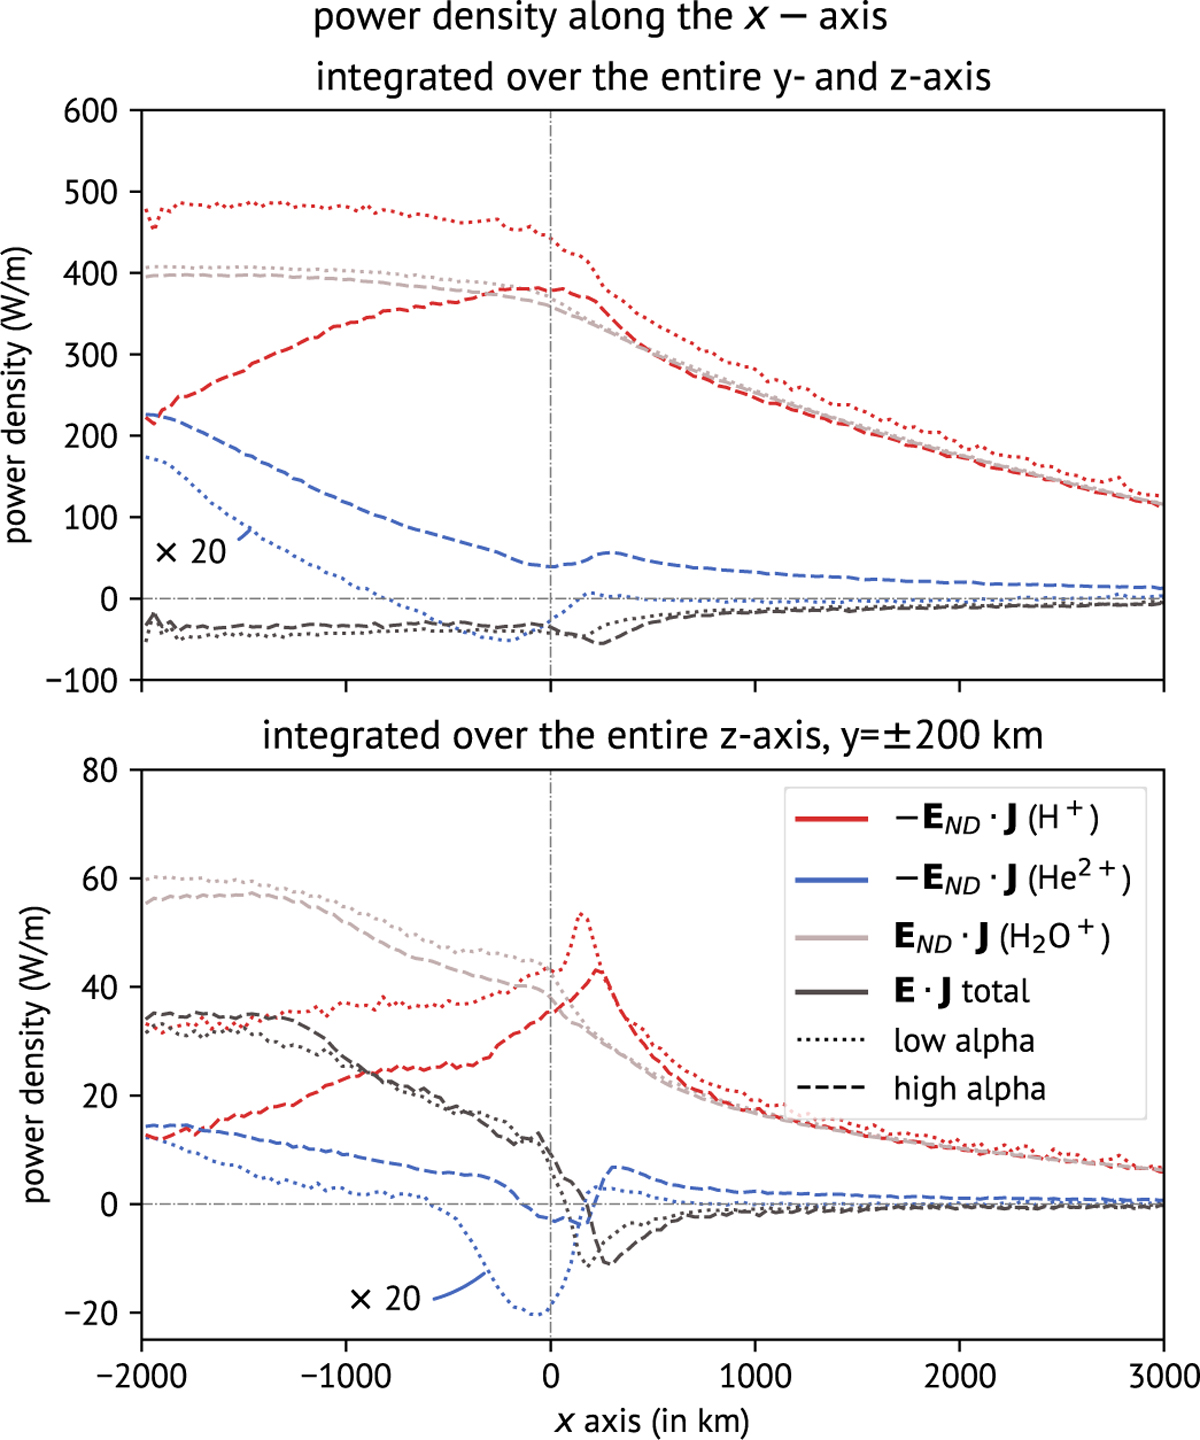
Power density of the individual ion species (protons: red, alphas: blue, and cometary ions: grey) and total E ∙ J (black) along the x-axis. The dotted and dashed lines show the results of the low- and highalpha cases. In the upper panel the power density is integrated along the entire y- and z-axes. For the lower panel, we only integrate between y = ± 200 km along the y-axis. For the SW species the negative values are shown since these species mostly function as generators. The curve for the power density of alpha particles for the low-alpha case (dotted blue line) is scaled by a factor of 20 to improve visibility.
Current usage metrics show cumulative count of Article Views (full-text article views including HTML views, PDF and ePub downloads, according to the available data) and Abstracts Views on Vision4Press platform.
Data correspond to usage on the plateform after 2015. The current usage metrics is available 48-96 hours after online publication and is updated daily on week days.
Initial download of the metrics may take a while.