Fig. 5
Download original image
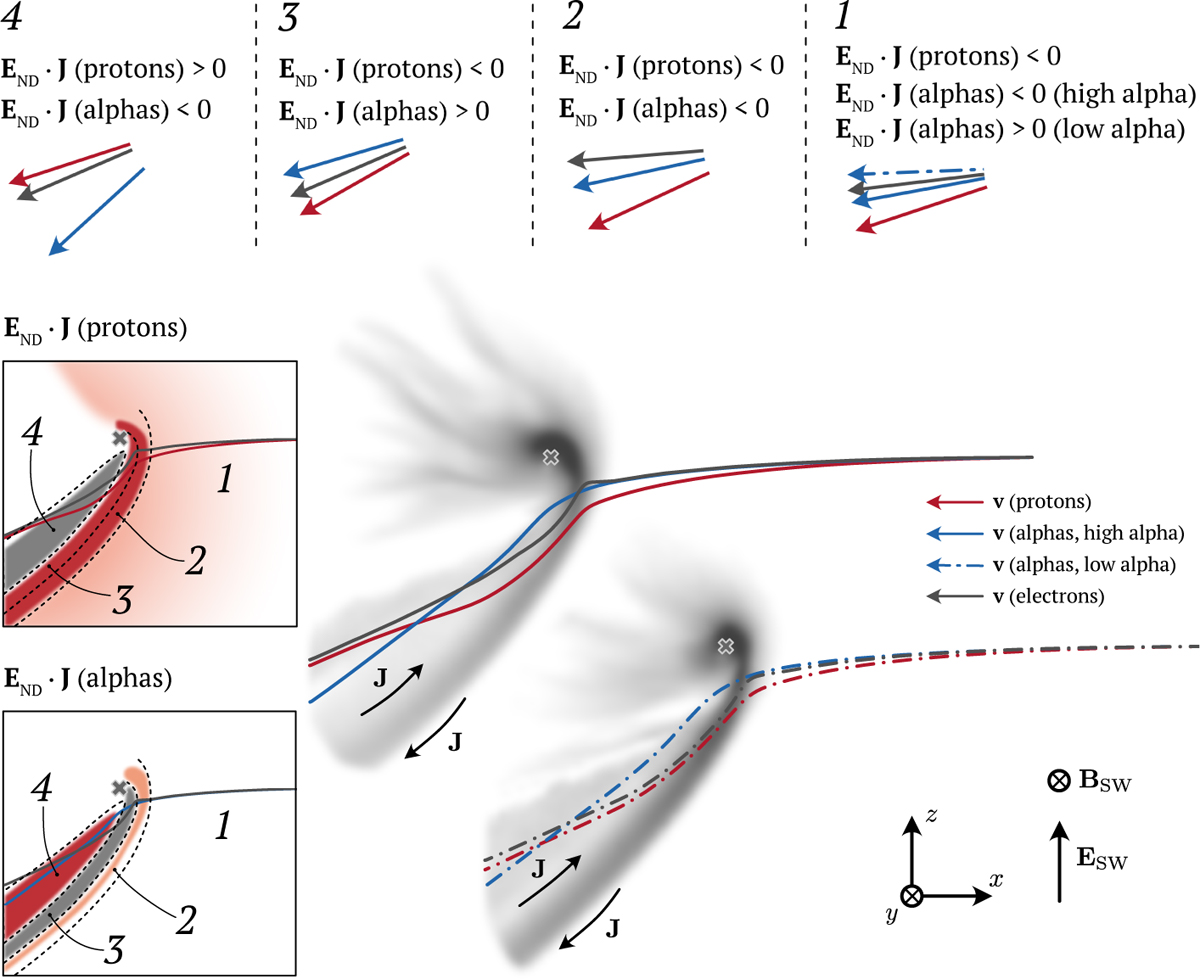
Illustration of proton, alpha, and electron bulk velocities and derived flow lines in the x - z plane at y = 0 km. In the upper row, arrows show the plasma velocities in different areas (marked 1-4), corresponding to different combinations of generator and load regions for alphas and protons. The deflection angles are exaggerated for illustration purposes. The areas are defined in the two insets to the right, which show the END ∙ J for protons and alphas in the high-alpha case (cf. Fig. 3, row 2). The lower right part of the figure shows the flow lines for the low- and high-alpha case, with the magnitude of the magnetic field (cf. Fig. 1, panels a and b) in greyscale in the background. There, the relative position of the flow lines with respect to the magnetic field pile-up layer can be seen. Solid lines: high-alpha case; dash-dotted lines: low-alpha case. Red, blue, and grey indicate protons, alphas, and electrons, respectively. The grey ‘x’ marker indicates the position of the comet nucleus. The flow line plots for the low-and high-alpha case are separated for improved visibility.
Current usage metrics show cumulative count of Article Views (full-text article views including HTML views, PDF and ePub downloads, according to the available data) and Abstracts Views on Vision4Press platform.
Data correspond to usage on the plateform after 2015. The current usage metrics is available 48-96 hours after online publication and is updated daily on week days.
Initial download of the metrics may take a while.