Fig. 1.
Download original image
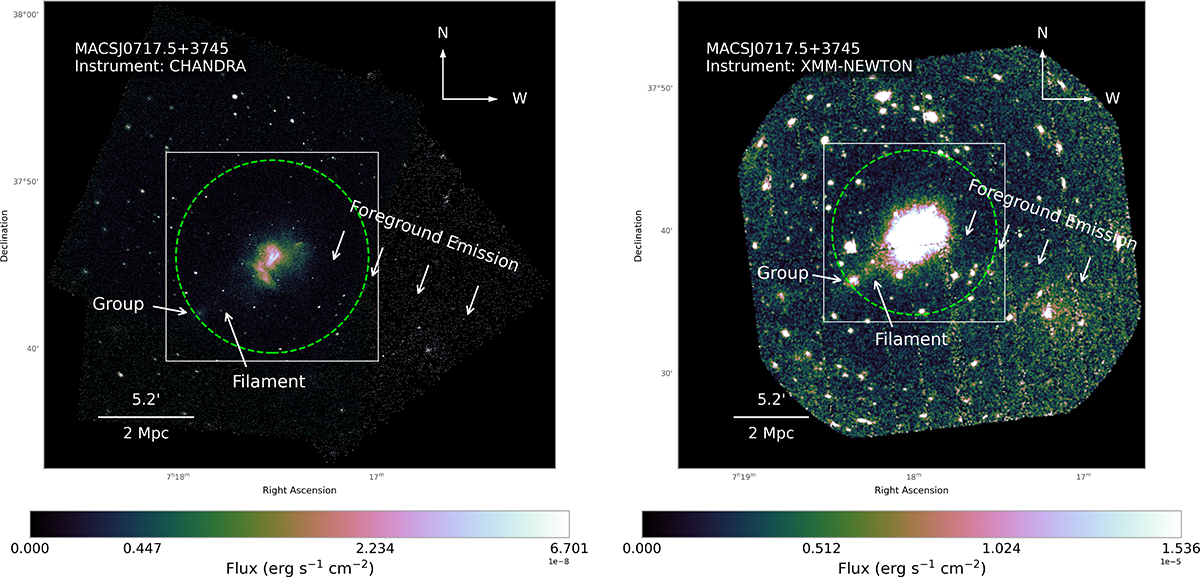
Images of the full FOV of Chandra (left) and XMM-Newton (right) of MACS J0717.5+3745. The surface brightness excess to the west/south-west are several foreground structures in between us and the cluster, indicated by the ‘foreground emission’ label. The XMM-Newton image is over-saturated in the cluster centre so that this can be seen more clearly. The green dashed circle indicates the approximate R200 of the cluster. Intensity scale is in flux per pixel (0.492 × 0.492 arcsec for Chandra, and 4.1 × 4.1 arcsec for XMM pn).
Current usage metrics show cumulative count of Article Views (full-text article views including HTML views, PDF and ePub downloads, according to the available data) and Abstracts Views on Vision4Press platform.
Data correspond to usage on the plateform after 2015. The current usage metrics is available 48-96 hours after online publication and is updated daily on week days.
Initial download of the metrics may take a while.