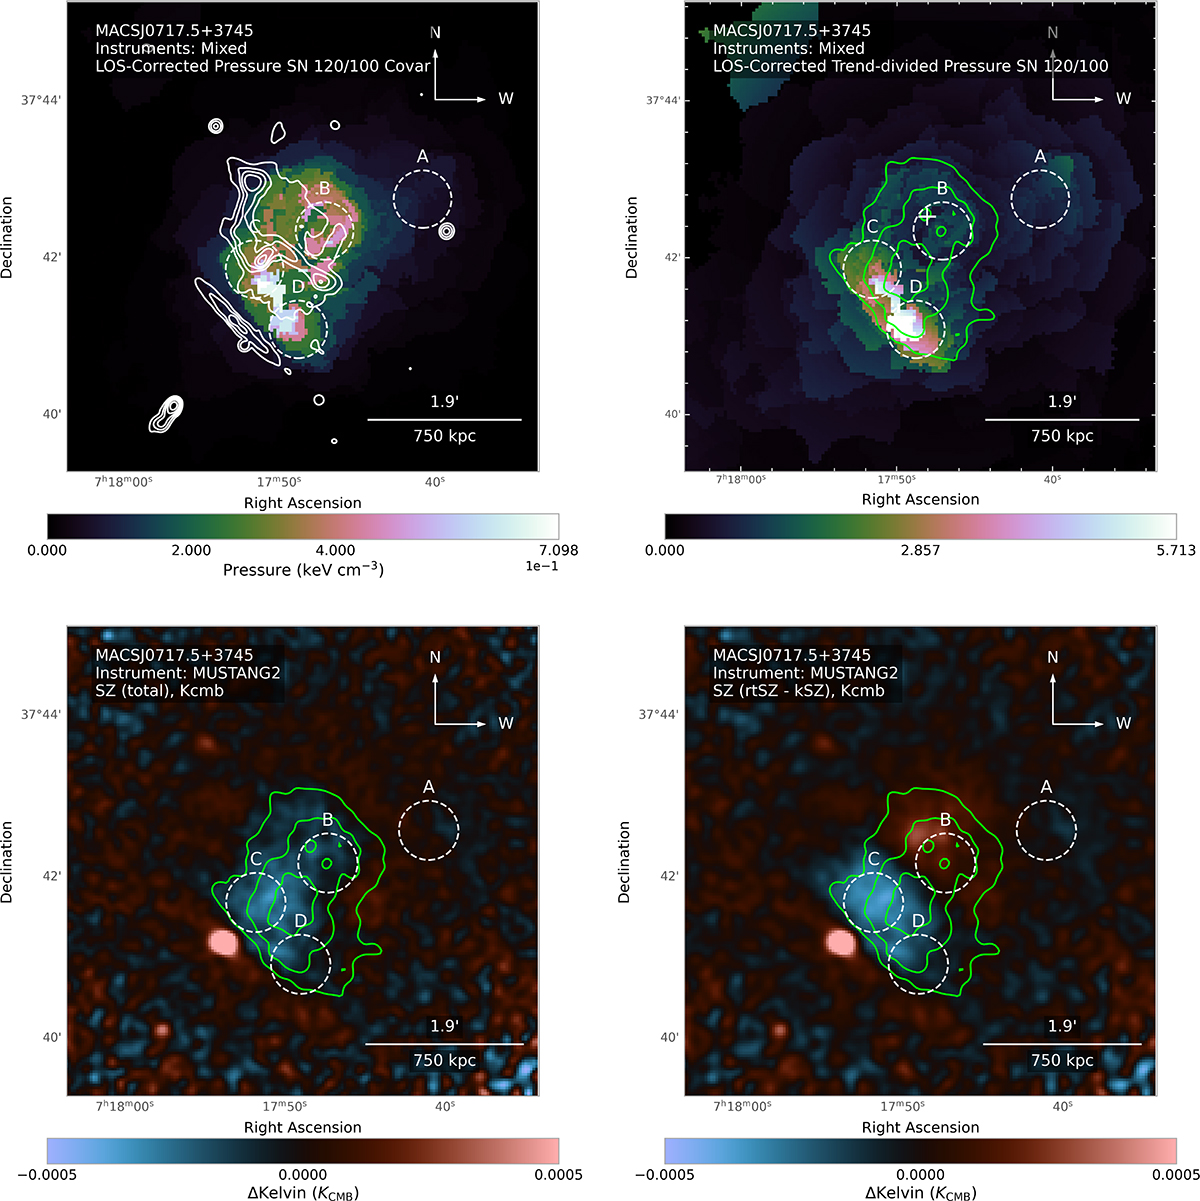
Fig. 11.
Download original image
Comparison plots between the geometry-corrected X-ray pressure map (top left), the geometry-corrected trend-divided X-ray pressure map (top-right), followed by SZ MUSTANG2 data (bottom-left), next to a kinetic and relativistic SZ corrected version of the data, shown here in KelvinCMB units (bottom-right). The white contours are from the radio images seen in van Weeren et al. (2017) and the green contours corresponds to the MUSTANG2 data in the bottom-left. The circles represent the strong lensing sub-cluster centres given in Limousin et al. (2016), which were used to reproduce the kSZ+rSZ model used in Adam et al. (2017b), displayed in Table 7. The full FOV of the MUSTANG2 data can be seen in Appendix C.
Current usage metrics show cumulative count of Article Views (full-text article views including HTML views, PDF and ePub downloads, according to the available data) and Abstracts Views on Vision4Press platform.
Data correspond to usage on the plateform after 2015. The current usage metrics is available 48-96 hours after online publication and is updated daily on week days.
Initial download of the metrics may take a while.