Open Access
Fig. 12.
Download original image
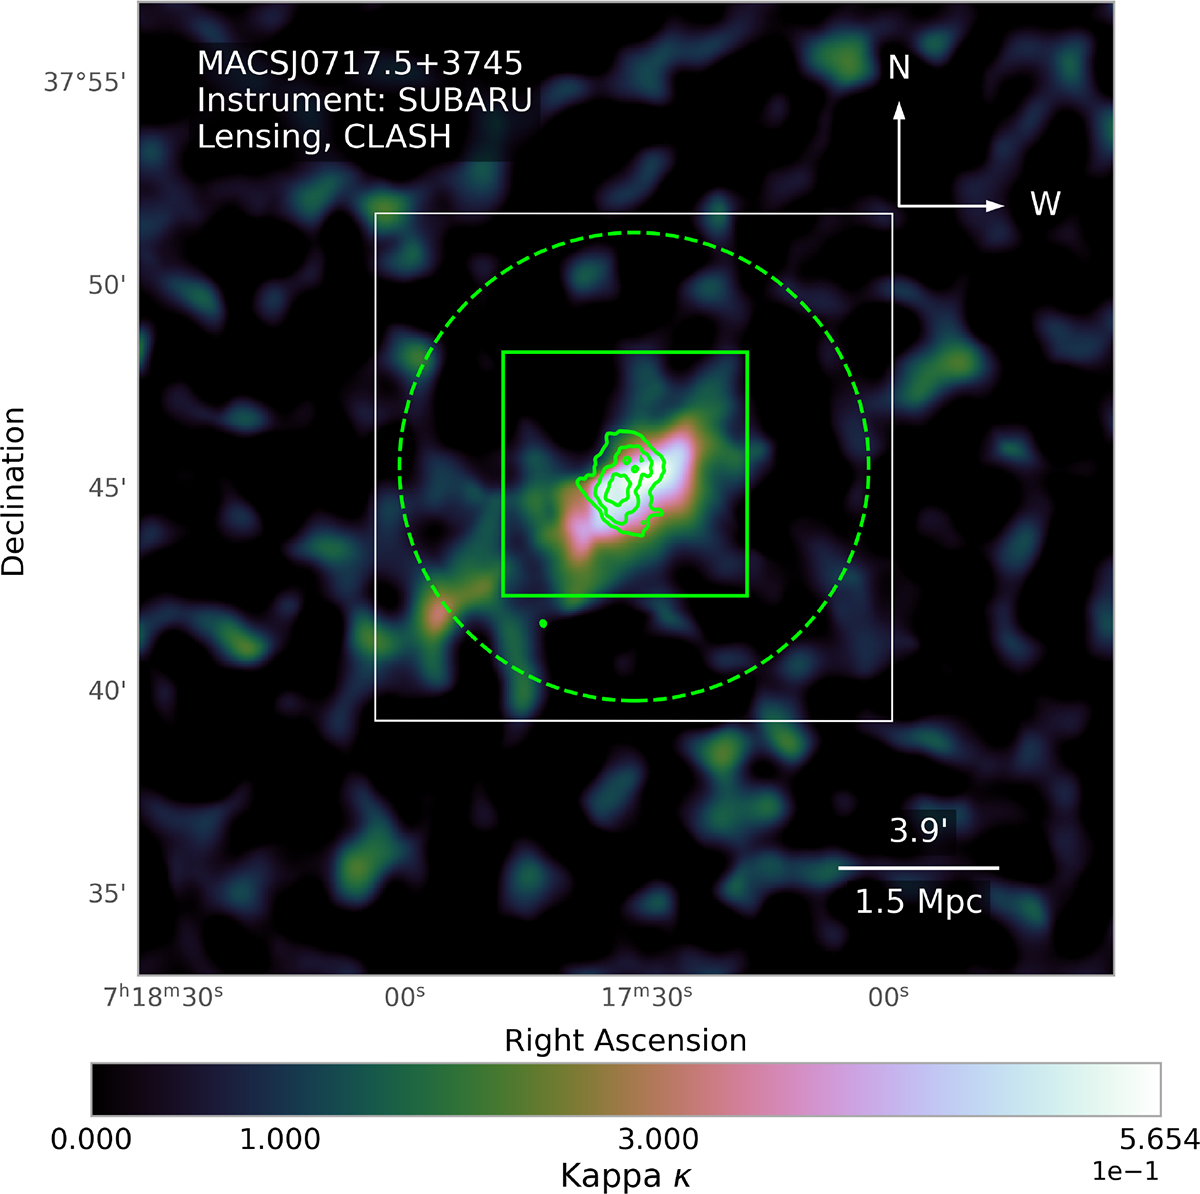
Weak-lensing map from the CLASH survey (Umetsu et al. 2014). The white box corresponds to the same FOV as the MUSTANG2 data and the other thermodynamical maps. The green box corresponds to the zoom-in region shown in Fig. 11.
Current usage metrics show cumulative count of Article Views (full-text article views including HTML views, PDF and ePub downloads, according to the available data) and Abstracts Views on Vision4Press platform.
Data correspond to usage on the plateform after 2015. The current usage metrics is available 48-96 hours after online publication and is updated daily on week days.
Initial download of the metrics may take a while.