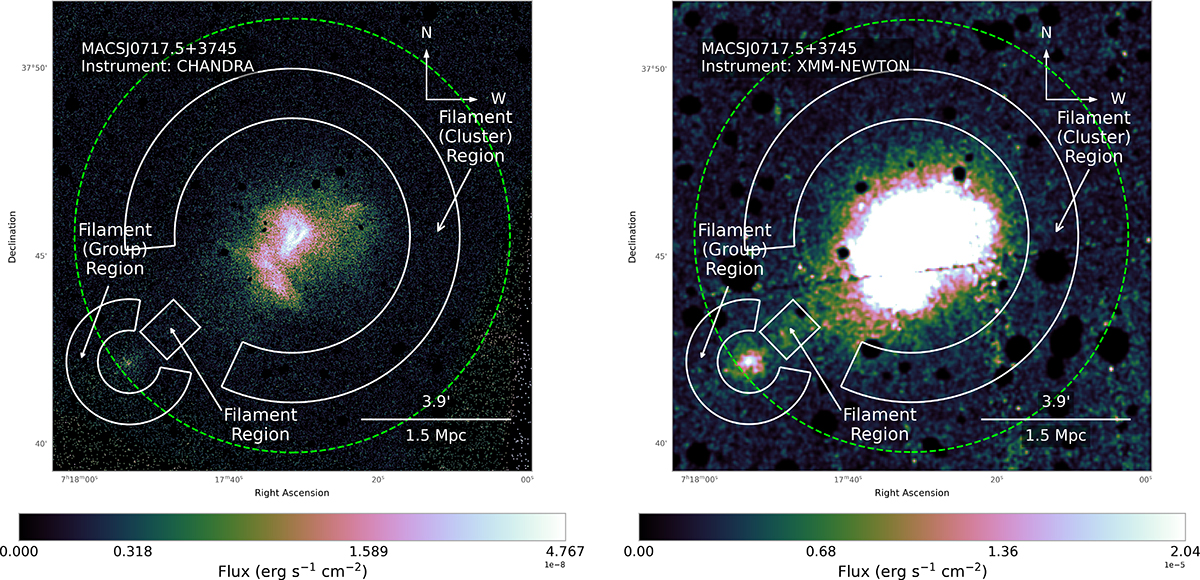
Fig. 2.
Download original image
Chandra (left) and XMM-Newton (right) images of MACS J0717.5+3745, restricted to the same FOV as the SZ data and thermodynamical maps, visible as the box in Fig. 1. Intensity scale is in flux per pixel (0.492 × 0.492 arcsec for Chandra, and 4.1 × 4.1 arcsec for XMM pn). Part of the XMM-Newton image is over-saturated so that the filament structure is more visible. The white lines indicate the regions used for modelling the spectra of the outskirts of the cluster and the group together with the filament. The green dashed circle indicates the approximate R200 of the cluster.
Current usage metrics show cumulative count of Article Views (full-text article views including HTML views, PDF and ePub downloads, according to the available data) and Abstracts Views on Vision4Press platform.
Data correspond to usage on the plateform after 2015. The current usage metrics is available 48-96 hours after online publication and is updated daily on week days.
Initial download of the metrics may take a while.