Fig. 4.
Download original image
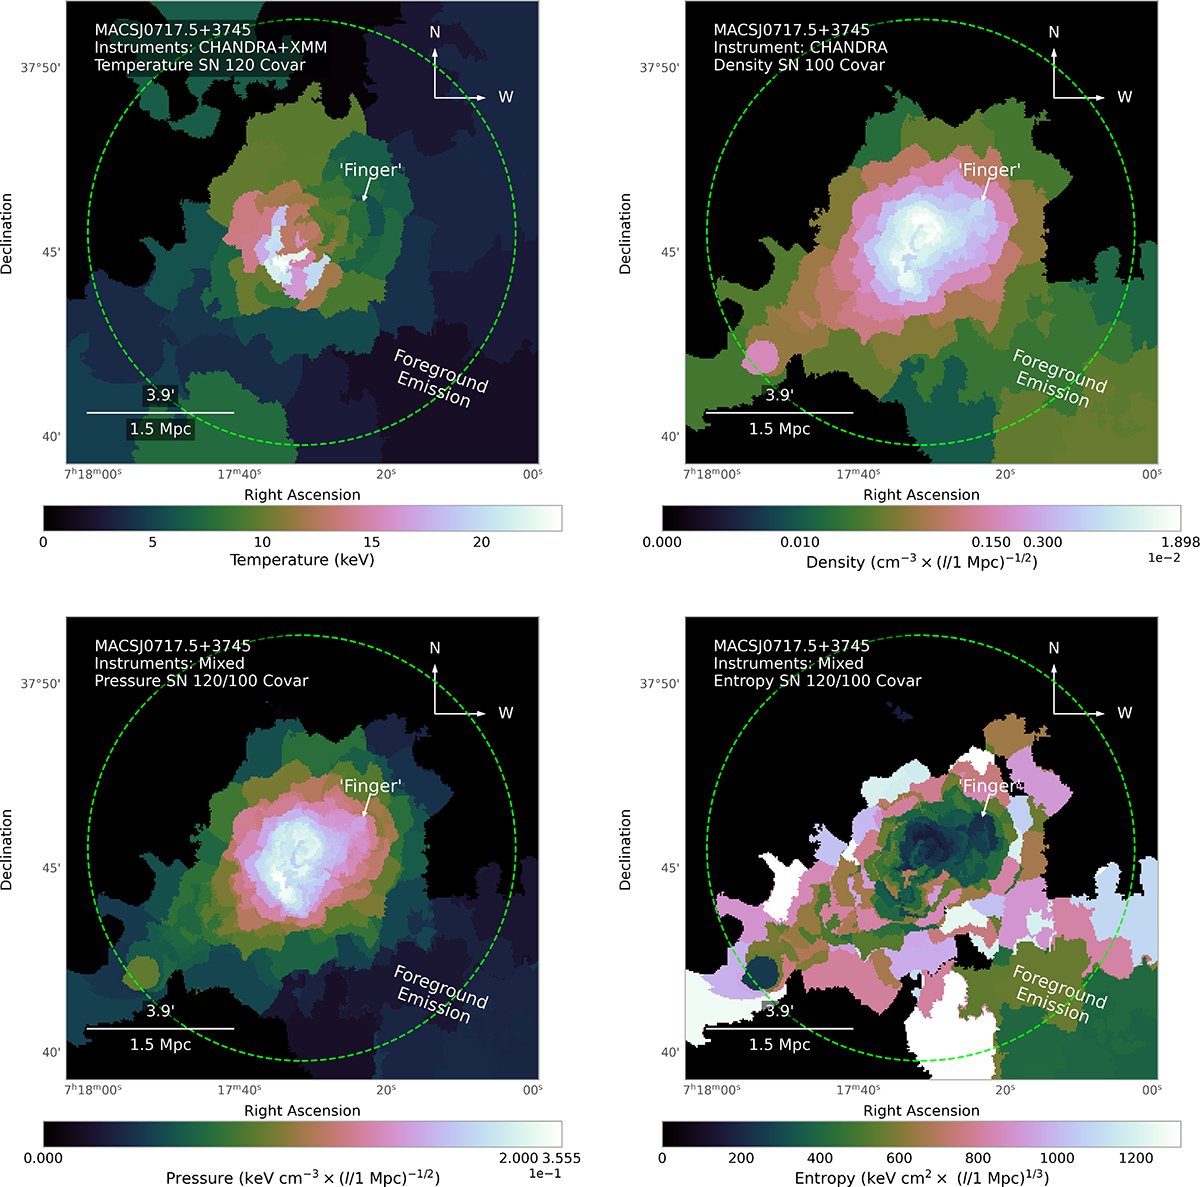
Maps of temperature (top left), density (top right), pressure (bottom left), and entropy (bottom right) with corresponding units of keV, cm−3×(l/1Mpc)−1/2, keVcm−3×(l/1Mpc)−1/2, and keVcm2× (l/1 Mpc)1/3. The temperature and electron density maps were created using binning with a S/N of 120 (14400 counts) and 100 (10000 counts), respectively, while the pressure and entropy maps were produced using the results from the top two S/N maps. Density maps were derived from the normalization fits assuming a 1 Mpc projected LOS depth. Spectral fits were made using data from both Chandra and XMM-Newton for the temperature, and only Chandra for the density, each using the CXB best-fit results from ROSAT, Chandra, and XMM-Newton. Fits for these maps were performed using the most appropriate background model for each region according to the AIC.
Current usage metrics show cumulative count of Article Views (full-text article views including HTML views, PDF and ePub downloads, according to the available data) and Abstracts Views on Vision4Press platform.
Data correspond to usage on the plateform after 2015. The current usage metrics is available 48-96 hours after online publication and is updated daily on week days.
Initial download of the metrics may take a while.