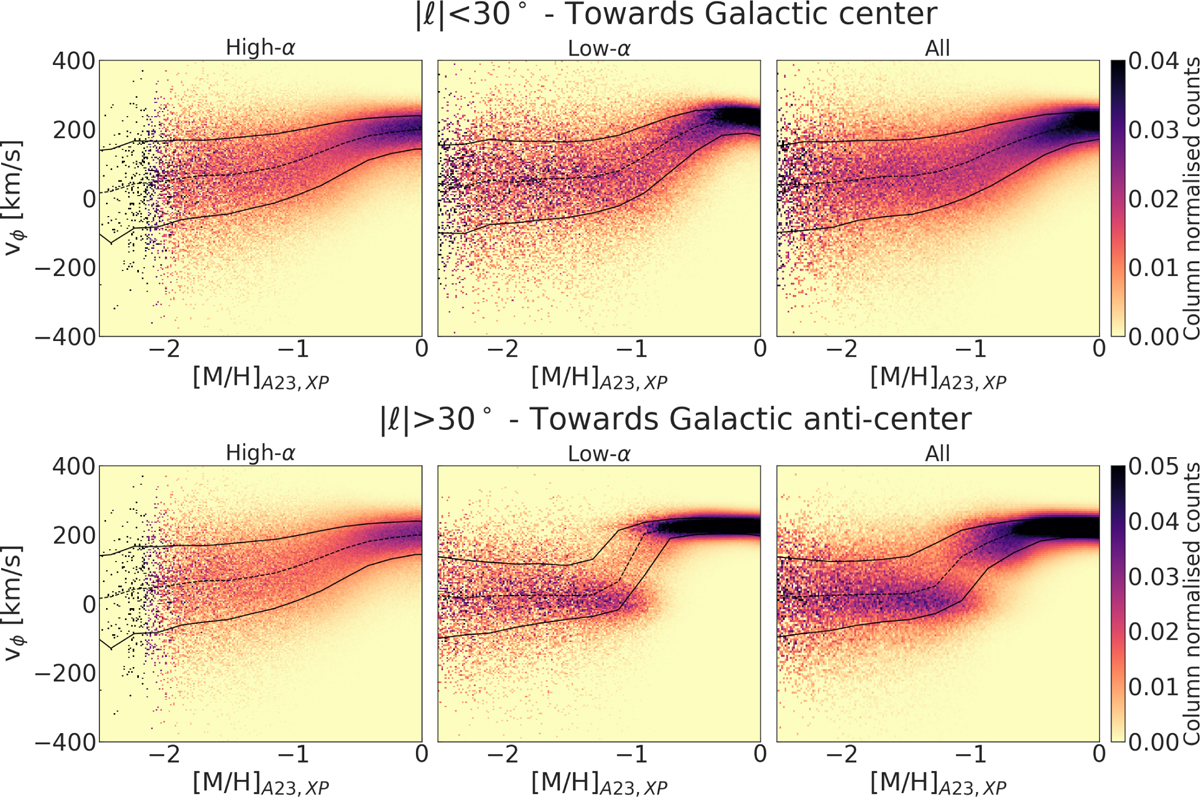
Fig. A.1
Download original image
Column-normalised (by sum) 2D histogram of stars in the [M/H]−vϕ plane for all the stars (right), high-α selection (left), and low-α selection (middle) towards the Galactic centre (top panels) and away from the Galactic centre (anti-centre, bottom panels). The running median track is shown as dashed black line and the 16th and 84th percentile tracks are shown as black lines in all panels. We can see that the low-α stars are not fully two separate populations towards the inner Galaxy due to contamination from the proto-Galaxy in the low-α end, that creates a small connection between the thin disc and halo populations in the overall [M/H]−vϕ plane for low-α stars as seen in Figure 3. Low- α stars towards the Galactic anti-centre show a cleaner, two separate population of thin disc and halo stars as expected. This effect is also reflected in the all stars panel. This effect is minimal in the APOGEE α-selection, most likely due to the high-resolution α-measurements.
Current usage metrics show cumulative count of Article Views (full-text article views including HTML views, PDF and ePub downloads, according to the available data) and Abstracts Views on Vision4Press platform.
Data correspond to usage on the plateform after 2015. The current usage metrics is available 48-96 hours after online publication and is updated daily on week days.
Initial download of the metrics may take a while.