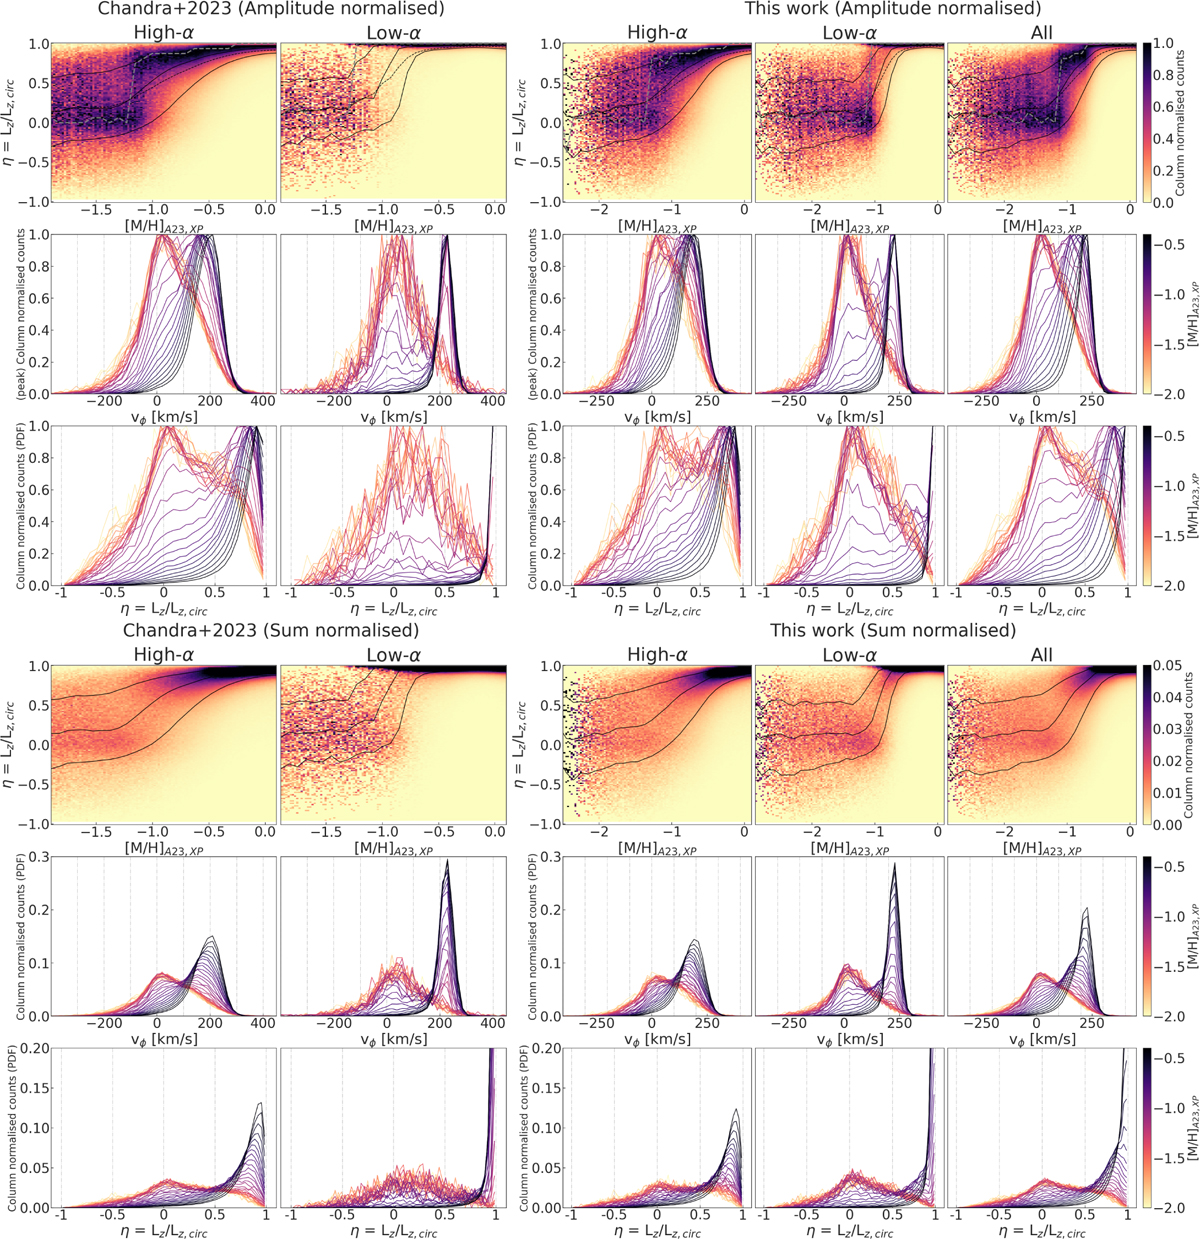
Fig. B.1
Download original image
Orbital circularity vs metallicity for high-α, low-α, and all stars, and 1D histogram of azimuthal velocity and orbital circularity at different metallicity bins for column-normalisation by amplitude (top panels) and by sum (bottom panels) using Chandra et al. (2024) α-selection (left panels) vs the α-selection implemented in this work (right panels). Running median (black line), mean (black dashed line), mode (grey dashed line), 16th and 84th percentile (black lines) tracks are overlaid for the 2D histograms with column normalisation by amplitude. We can see that the mean and median tracks follow each other closely except at higher metallicities where the non-Gaussianity of thin and thick discs dominates, whereas the mode tracks follow the peaks of the background and is very noisy and resembles the step function behaviour seen by Chandra et al. (2024), even for high-α stars where we see a gradual spin-up (across increasing [M/H]) using column normalisation by sum. Running median, 16th and 84th percentile tracks are overlaid as black lines for the 2D histograms with column normalisation by sum. We also see that our α-selection has a cleaner high-α sample and isolates the bulk of GES into the low-α sample.
Current usage metrics show cumulative count of Article Views (full-text article views including HTML views, PDF and ePub downloads, according to the available data) and Abstracts Views on Vision4Press platform.
Data correspond to usage on the plateform after 2015. The current usage metrics is available 48-96 hours after online publication and is updated daily on week days.
Initial download of the metrics may take a while.