Fig. 4
Download original image
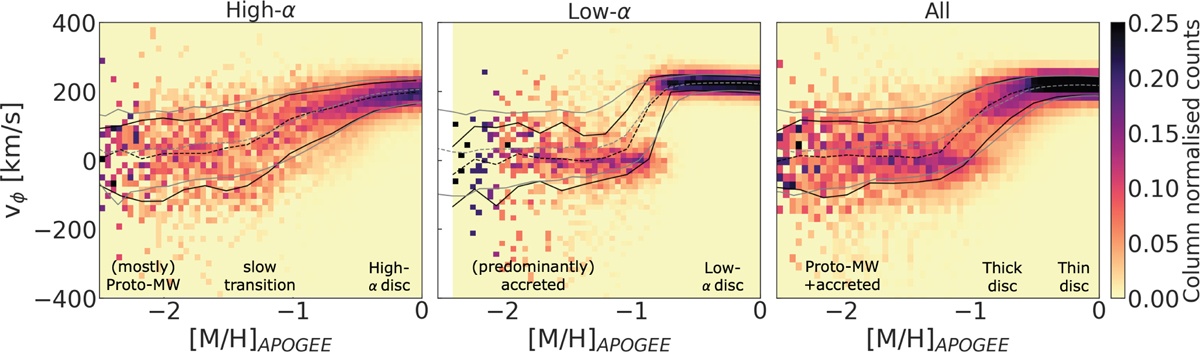
Column-normalised (by sum) 2D histogram of stars in the [M/H]−vϕ plane for APOGEE DR 17 giants (with the same high- and low-α separation as shown in Figure 1) for all the stars (right), high-α selection (left), and low-α selection (middle). The running median track is shown as dashed black line and the 16th and 84th percentile tracks are shown as black lines in all panels. The median, 16th and 84th percentile tracks for our Gaia XP sample are shown in grey for comparison. The tracks between Gaia XP and APOGEE samples show remarkable resemblance in high-α and small differences for low-α and all stars due to lower contamination in low-α selection in APOGEE (see Appendix A).
Current usage metrics show cumulative count of Article Views (full-text article views including HTML views, PDF and ePub downloads, according to the available data) and Abstracts Views on Vision4Press platform.
Data correspond to usage on the plateform after 2015. The current usage metrics is available 48-96 hours after online publication and is updated daily on week days.
Initial download of the metrics may take a while.