Fig. 8
Download original image
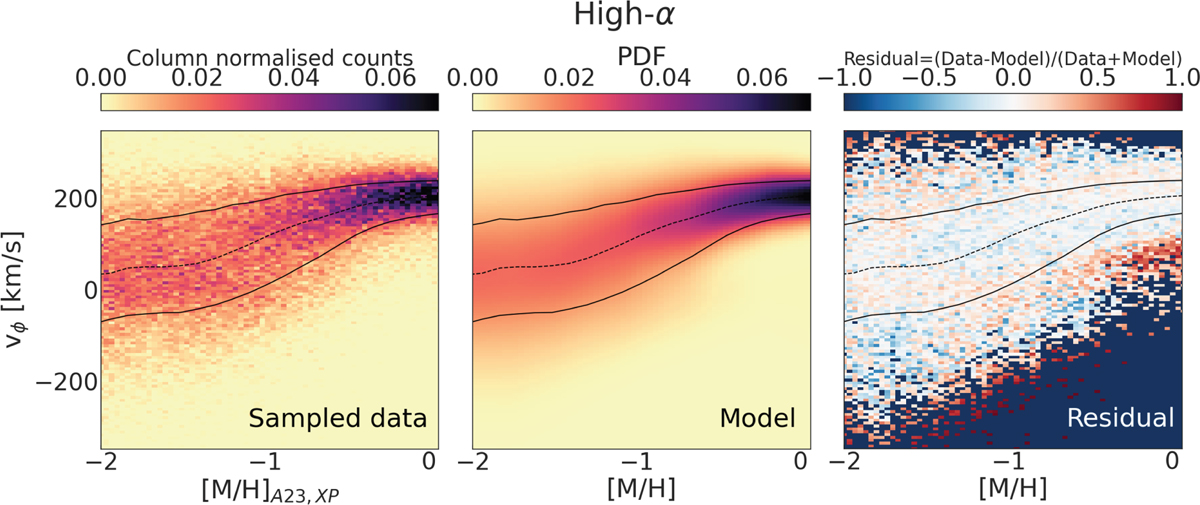
Distribution of sampled data column normalised by sum (left), model colour-coded by the probability density function (centre), and the normalised residual (right) in the [M/H]−vϕ plane (azimuthal velocity vs metallicity) for high-α evolving means model. The flat distribution of red stars at higher metallicities in the residuals show that the model is not able to fit the non-Gaussianity (long tail towards lower velocities) of the high-α disc. The systematic scatter in the periphery is due to random error in the data. However, for [M/H]<−0.7, the lack of strong systematic patterns, the low-amplitude, and the small scatter of the residuals in the central regions (with the major bulk of the data) verifies the validity of the model. The median, 16th and 84th percentile tracks for our data are shown in black lines to guide the eye towards the bulk of the data.
Current usage metrics show cumulative count of Article Views (full-text article views including HTML views, PDF and ePub downloads, according to the available data) and Abstracts Views on Vision4Press platform.
Data correspond to usage on the plateform after 2015. The current usage metrics is available 48-96 hours after online publication and is updated daily on week days.
Initial download of the metrics may take a while.