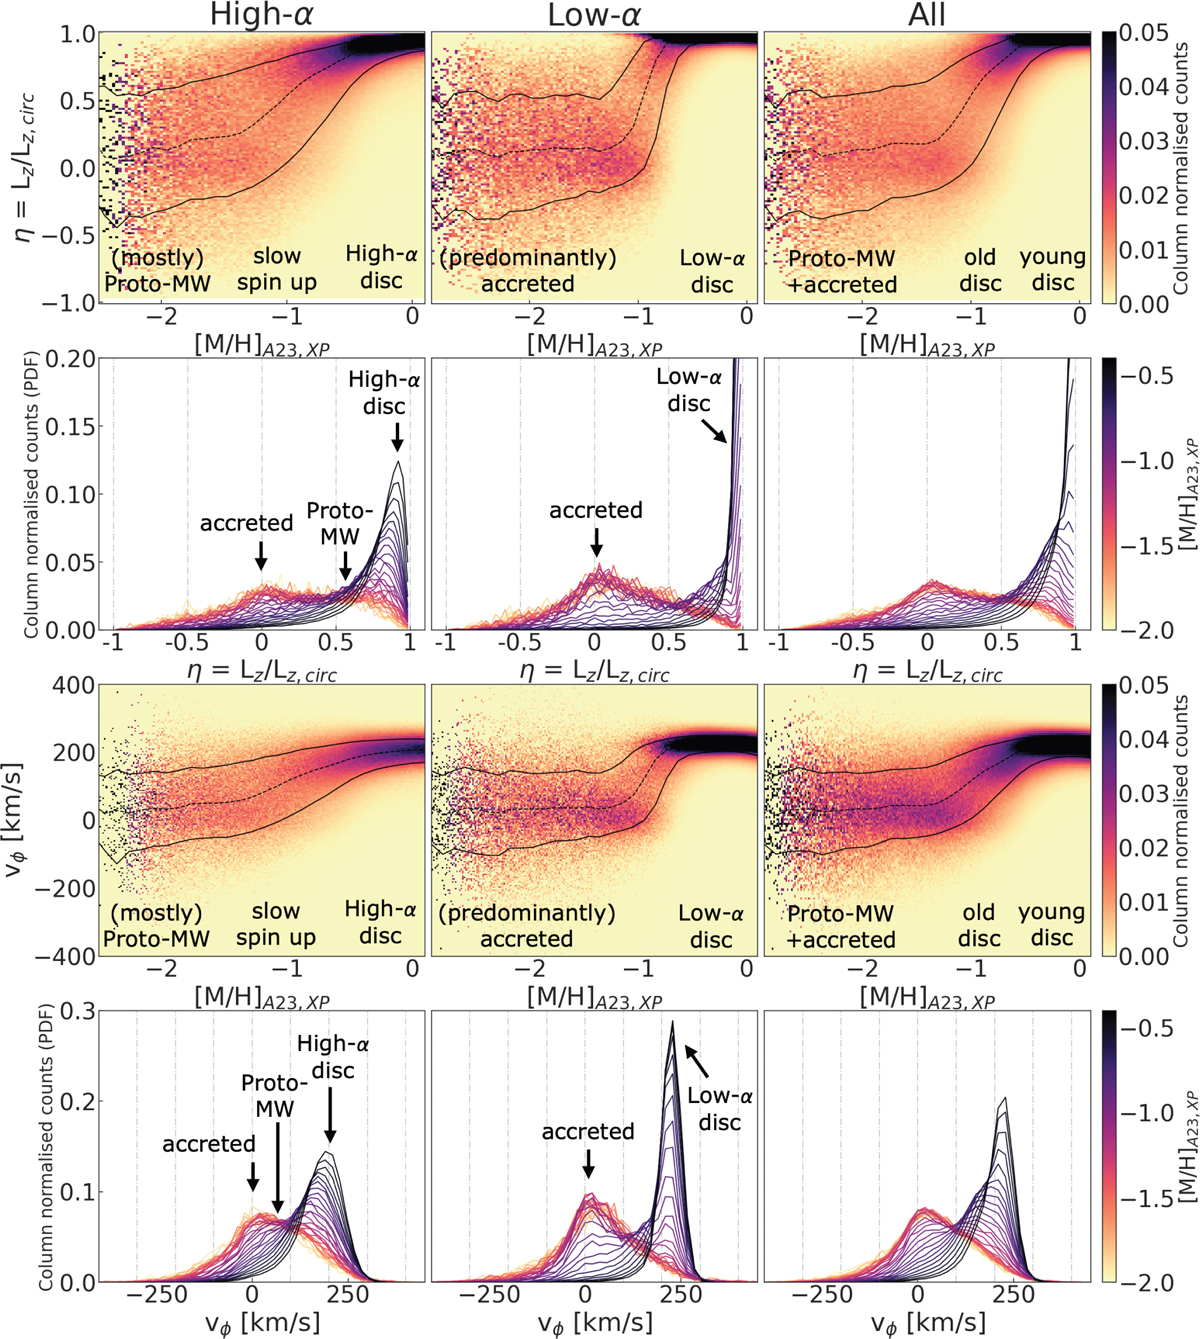
Fig. 9
Download original image
Top: column-normalised (by sum) 2D histogram of stars in the [M/H]−η plane (orbital circularity vs metallicity, top) and [M/H]−vϕ plane (azimuthal velocity vs metallicity, middle bottom) for all the stars (right), high-α selection (left), and low-α selection (midde). The running median track is shown as dashed black line and the 16th and 84th percentile tracks are shown as black lines in all panels. The running median tracks for the all stars and low-α panels look more like a step-function, while the high-α tracks are shallower, supporting the more gradual spin-up phase with respect to metallicities. (middle top) Probability density functions (PDF) of η in bins of [M/H] for all the stars (right), high-α selection (left), and low-α selection (middle). (bottom) Probability density functions (PDF) of vϕ in bins of [M/H] for all the stars (right), high-α selection (left), and low-α selection (middle). We note the second peak with low net spin in high-α panel slowly gains rotation with increasing [M/H] and spins-up into the old high-α disc in both middle top and bottom panels.
Current usage metrics show cumulative count of Article Views (full-text article views including HTML views, PDF and ePub downloads, according to the available data) and Abstracts Views on Vision4Press platform.
Data correspond to usage on the plateform after 2015. The current usage metrics is available 48-96 hours after online publication and is updated daily on week days.
Initial download of the metrics may take a while.